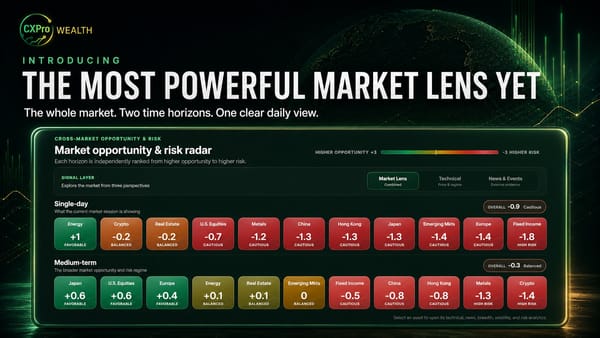
Market Lens - July 16, 2026
Medium-term opportunities favor US equities, real estate, and Japan, while single-day breadth is cautious and event risk remains elevated.

Market Lens — July 16, 2026
Medium-term opportunities persist despite concentrated cross-asset risks
Medium-term opportunities favor US equities, real estate, and Japan, while single-day breadth is cautious and event risk remains elevated.
Market opportunity & risk radar
Each horizon is independently ranked from higher opportunity to higher risk.
Single-day
What the current market session is showing
Medium-term
The broader market opportunity and risk regime
Single-day
Single-day trend, volatility, and opportunity
Medium-term
Medium-term trend, volatility, and opportunity
Single-day
Single-day tailwind and headwind pressure
Medium-term
Medium-term tailwind and headwind pressure
Select an asset to open its technical, news, breadth, volatility, and risk analytics.
US Equities
Price and breadth were mixed, while fresh-event scoring was excluded by publication validation. The combined single-day setup is balanced with normal risk. The single-day picture diverges from the strong opportunity medium-term regime. This single-day view is partial because only one branch passed usability checks.
Market Lens opportunity & risk
Symbols advancing
Same-session price breadth. A low reading means most tracked symbols declined during the session.
Critical pressure balance
US Equities
US Equities is rated strong opportunity on the available technical evidence, while the missing branch limits confirmation.
Market Lens opportunity & risk
Symbols advancing
Same-session price breadth. A low reading means most tracked symbols declined during the session.
Critical pressure balance
US Equities
The single-day was mixed with 4 advancing, 5 declining, and 1 unchanged symbols. Daily conditions are diverging from the medium-term opportunity score of 1.5. Risk was normal and the risk-adjusted daily setup was balanced.
Technical opportunity & risk
Regime at a glance
Read together with the selected-horizon technical opportunity score above.
Symbols advancing
Same-session price breadth. A low reading means most tracked symbols declined during the session.
US Equities
Broadly favorable uptrend with balanced risk
Technical opportunity & risk
Regime at a glance
Read together with the selected-horizon technical opportunity score above.
Symbols advancing
Same-session price breadth. A low reading means most tracked symbols declined during the session.
US Equities
Inside the window from the July 15 close through the July 16 cutoff, fresh verified events produced a strong bullish directional balance and high event risk. The largest immediate driver was tsmc outlook reinforces ai capital spending.
News & Events opportunity & risk
Critical pressure balance
US Equities
News & Events branch excluded by publication validation
News & Events opportunity & risk
Critical pressure balance
Japan Equities
Price and breadth were bearish, while fresh-event direction was strong bullish with elevated event risk. The combined single-day setup is balanced with normal risk. The single-day picture diverges from the favorable medium-term regime.
Market Lens opportunity & risk
Symbols advancing
Same-session price breadth. A low reading means most tracked symbols declined during the session.
Critical pressure balance
Japan Equities
Japan Equities is rated favorable; technical conditions and verified news & events evidence are both favorable, with manageable divergence.
Market Lens opportunity & risk
Symbols advancing
Same-session price breadth. A low reading means most tracked symbols declined during the session.
Critical pressure balance
Japan Equities
The single-day was bearish with 0 advancing, 5 declining, and 0 unchanged symbols. This conflicts with the medium-term opportunity score of 1.6. Risk was normal and the risk-adjusted daily setup was cautious.
Technical opportunity & risk
Regime at a glance
Read together with the selected-horizon technical opportunity score above.
Symbols advancing
Same-session price breadth. A low reading means most tracked symbols declined during the session.
Japan Equities
Broadly favorable uptrend with balanced risk
Technical opportunity & risk
Regime at a glance
Read together with the selected-horizon technical opportunity score above.
Symbols advancing
Same-session price breadth. A low reading means most tracked symbols declined during the session.
Japan Equities
Inside the window from the July 15 close through the July 16 cutoff, fresh verified events produced a strong bullish directional balance and elevated event risk. The largest immediate driver was ai semiconductor demand supports japanese suppliers.
News & Events opportunity & risk
Critical pressure balance
Japan Equities
Moderate tailwind balance: AI semiconductor demand supports Japanese suppliers
News & Events opportunity & risk
Critical pressure balance
Real Estate
Price and breadth were bullish, while fresh-event scoring was excluded by publication validation. The combined single-day setup is favorable with normal risk. This single-day view is partial because only one branch passed usability checks.
Market Lens opportunity & risk
Symbols advancing
Same-session price breadth. A low reading means most tracked symbols declined during the session.
Critical pressure balance
No verified tailwind pressure for this horizon.
Real Estate
Real Estate is rated favorable on the available technical evidence, while the missing branch limits confirmation.
Market Lens opportunity & risk
Symbols advancing
Same-session price breadth. A low reading means most tracked symbols declined during the session.
Critical pressure balance
Real Estate
The single-day was bullish with 5 advancing, 1 declining, and 0 unchanged symbols. Daily conditions are aligned with the medium-term regime. Risk was normal and the risk-adjusted daily setup was favorable.
Technical opportunity & risk
Regime at a glance
Read together with the selected-horizon technical opportunity score above.
Symbols advancing
Same-session price breadth. A low reading means most tracked symbols declined during the session.
Real Estate
Broadly favorable uptrend with balanced risk
Technical opportunity & risk
Regime at a glance
Read together with the selected-horizon technical opportunity score above.
Symbols advancing
Same-session price breadth. A low reading means most tracked symbols declined during the session.
Real Estate
Inside the window from the July 15 close through the July 16 cutoff, fresh verified events produced a strong bearish directional balance and high event risk. The largest immediate driver was energy shock risk can delay financing relief.
News & Events opportunity & risk
Critical pressure balance
No verified tailwind pressure for this horizon.
Real Estate
News & Events branch excluded by publication validation
News & Events opportunity & risk
Critical pressure balance
Europe Equities
Price and breadth were bearish, while fresh-event direction was mixed with high event risk. The combined single-day setup is cautious with elevated risk. The single-day picture conflicts with the favorable medium-term regime.
Market Lens opportunity & risk
Symbols advancing
Same-session price breadth. A low reading means most tracked symbols declined during the session.
Critical pressure balance
Europe Equities
Europe Equities is rated favorable; technical conditions are favorable while news & events evidence remains balanced, with manageable divergence.
Market Lens opportunity & risk
Symbols advancing
Same-session price breadth. A low reading means most tracked symbols declined during the session.
Critical pressure balance
Europe Equities
The single-day was bearish with 1 advancing, 5 declining, and 0 unchanged symbols. This conflicts with the medium-term opportunity score of 1.0. Risk was low and the risk-adjusted daily setup was cautious.
Technical opportunity & risk
Regime at a glance
Read together with the selected-horizon technical opportunity score above.
Symbols advancing
Same-session price breadth. A low reading means most tracked symbols declined during the session.
Europe Equities
Broadly favorable uptrend with balanced risk
Technical opportunity & risk
Regime at a glance
Read together with the selected-horizon technical opportunity score above.
Symbols advancing
Same-session price breadth. A low reading means most tracked symbols declined during the session.
Europe Equities
Inside the window from the July 15 close through the July 16 cutoff, fresh verified events produced a mixed directional balance and high event risk. The largest immediate driver was hormuz disruption raises energy and trade costs.
News & Events opportunity & risk
Critical pressure balance
Europe Equities
Balanced / neutral evidence: China slowdown weighs on export-sensitive sectors
News & Events opportunity & risk
Critical pressure balance
Emerging Markets Equities
Price and breadth were bearish, while fresh-event direction was mixed with high event risk. The combined single-day setup is cautious with elevated risk. The single-day picture diverges from the balanced medium-term regime.
Market Lens opportunity & risk
Symbols advancing
Same-session price breadth. A low reading means most tracked symbols declined during the session.
Critical pressure balance
Emerging Markets Equities
Emerging Markets Equities is rated balanced; technical conditions are favorable while news & events evidence remains balanced, with manageable divergence.
Market Lens opportunity & risk
Symbols advancing
Same-session price breadth. A low reading means most tracked symbols declined during the session.
Critical pressure balance
Emerging Markets Equities
The single-day was bearish with 0 advancing, 7 declining, and 0 unchanged symbols. Daily conditions are diverging from the medium-term opportunity score of 0.4. Risk was normal and the risk-adjusted daily setup was cautious.
Technical opportunity & risk
Regime at a glance
Read together with the selected-horizon technical opportunity score above.
Symbols advancing
Same-session price breadth. A low reading means most tracked symbols declined during the session.
Emerging Markets Equities
Range-bound, limited directional edge
Technical opportunity & risk
Regime at a glance
Read together with the selected-horizon technical opportunity score above.
Symbols advancing
Same-session price breadth. A low reading means most tracked symbols declined during the session.
Emerging Markets Equities
Inside the window from the July 15 close through the July 16 cutoff, fresh verified events produced a mixed directional balance and high event risk. The largest immediate driver was tsmc outlook strongly supports taiwan technology exposure.
News & Events opportunity & risk
Critical pressure balance
Emerging Markets Equities
Balanced / neutral evidence: TSMC outlook strongly supports Taiwan technology exposure
News & Events opportunity & risk
Critical pressure balance
Energy
Price and breadth were mixed, while fresh-event direction was strong bullish with high event risk. The combined single-day setup is favorable with elevated risk. The single-day picture diverges from the balanced medium-term regime.
Market Lens opportunity & risk
Symbols advancing
Same-session price breadth. A low reading means most tracked symbols declined during the session.
Critical pressure balance
Energy
Energy is rated balanced; both technical and news & events evidence remain broadly balanced, with manageable divergence.
Market Lens opportunity & risk
Symbols advancing
Same-session price breadth. A low reading means most tracked symbols declined during the session.
Critical pressure balance
Energy
The single-day was mixed with 2 advancing, 3 declining, and 0 unchanged symbols. Daily conditions are neutral with the medium-term regime. Risk was normal and the risk-adjusted daily setup was balanced.
Technical opportunity & risk
Regime at a glance
Read together with the selected-horizon technical opportunity score above.
Symbols advancing
Same-session price breadth. A low reading means most tracked symbols declined during the session.
Energy
Choppy sideways environment with elevated risk
Technical opportunity & risk
Regime at a glance
Read together with the selected-horizon technical opportunity score above.
Symbols advancing
Same-session price breadth. A low reading means most tracked symbols declined during the session.
Energy
Inside the window from the July 15 close through the July 16 cutoff, fresh verified events produced a strong bullish directional balance and high event risk. The largest immediate driver was hormuz disruption tightens perceived energy supply.
News & Events opportunity & risk
Critical pressure balance
Energy
Balanced / neutral evidence: Hormuz disruption tightens perceived energy supply
News & Events opportunity & risk
Critical pressure balance
Fixed Income
Price and breadth were bearish, while fresh-event scoring was excluded by publication validation. The combined single-day setup is cautious with low risk. The single-day picture diverges from the balanced medium-term regime. This single-day view is partial because only one branch passed usability checks.
Market Lens opportunity & risk
Symbols advancing
Same-session price breadth. A low reading means most tracked symbols declined during the session.
Critical pressure balance
Fixed Income
Fixed Income is rated balanced on the available technical evidence, while the missing branch limits confirmation.
Market Lens opportunity & risk
Symbols advancing
Same-session price breadth. A low reading means most tracked symbols declined during the session.
Critical pressure balance
Fixed Income
The single-day was bearish with 0 advancing, 3 declining, and 4 unchanged symbols. Daily conditions are diverging from the medium-term opportunity score of 0.1. Risk was low and the risk-adjusted daily setup was cautious.
Technical opportunity & risk
Regime at a glance
Read together with the selected-horizon technical opportunity score above.
Symbols advancing
Same-session price breadth. A low reading means most tracked symbols declined during the session.
Fixed Income
Range-bound, limited directional edge
Technical opportunity & risk
Regime at a glance
Read together with the selected-horizon technical opportunity score above.
Symbols advancing
Same-session price breadth. A low reading means most tracked symbols declined during the session.
Fixed Income
Inside the window from the July 15 close through the July 16 cutoff, fresh verified events produced a strong bearish directional balance and high event risk. The largest immediate driver was energy disruption raises inflation risk.
News & Events opportunity & risk
Critical pressure balance
Fixed Income
News & Events branch excluded by publication validation
News & Events opportunity & risk
Critical pressure balance
Hong Kong Equities
Price and breadth coverage was unavailable, while fresh-event direction was bullish with elevated event risk. The combined single-day setup is favorable with elevated risk. The single-day picture diverges from the balanced medium-term regime. This single-day view is partial because only one branch passed usability checks.
Market Lens opportunity & risk
Symbols advancing
Same-session price breadth. A low reading means most tracked symbols declined during the session.
Critical pressure balance
Hong Kong Equities
Hong Kong Equities is rated balanced; both technical and news & events evidence remain broadly balanced, with manageable divergence.
Market Lens opportunity & risk
Symbols advancing
Same-session price breadth. A low reading means most tracked symbols declined during the session.
Critical pressure balance
Hong Kong Equities
Single-day coverage is unavailable because only 1 of 4 expected symbols have usable same-session return and ATR data.
Technical opportunity & risk
Regime at a glance
Read together with the selected-horizon technical opportunity score above.
Symbols advancing
Same-session price breadth. A low reading means most tracked symbols declined during the session.
Hong Kong Equities
Range-bound, limited directional edge
Technical opportunity & risk
Regime at a glance
Read together with the selected-horizon technical opportunity score above.
Symbols advancing
Same-session price breadth. A low reading means most tracked symbols declined during the session.
Hong Kong Equities
Inside the window from the July 15 close through the July 16 cutoff, fresh verified events produced a bullish directional balance and elevated event risk. The largest immediate driver was ai demand supports technology-sector expectations.
News & Events opportunity & risk
Critical pressure balance
Hong Kong Equities
Balanced / neutral evidence: AI demand supports technology-sector expectations
News & Events opportunity & risk
Critical pressure balance
China Equities
Price and breadth were mixed, while fresh-event direction was bullish with elevated event risk. The combined single-day setup is favorable with normal risk. The single-day picture diverges from the balanced medium-term regime.
Market Lens opportunity & risk
Symbols advancing
Same-session price breadth. A low reading means most tracked symbols declined during the session.
Critical pressure balance
China Equities
China Equities is rated balanced; verified evidence is improving, but price confirmation remains weak or incomplete, with manageable divergence.
Market Lens opportunity & risk
Symbols advancing
Same-session price breadth. A low reading means most tracked symbols declined during the session.
Critical pressure balance
China Equities
The single-day was mixed with 3 advancing, 2 declining, and 1 unchanged symbols. Daily conditions are diverging from the medium-term opportunity score of -0.8. Risk was normal and the risk-adjusted daily setup was balanced.
Technical opportunity & risk
Regime at a glance
Read together with the selected-horizon technical opportunity score above.
Symbols advancing
Same-session price breadth. A low reading means most tracked symbols declined during the session.
China Equities
Persistent downtrend, caution warranted
Technical opportunity & risk
Regime at a glance
Read together with the selected-horizon technical opportunity score above.
Symbols advancing
Same-session price breadth. A low reading means most tracked symbols declined during the session.
China Equities
Inside the window from the July 15 close through the July 16 cutoff, fresh verified events produced a bullish directional balance and elevated event risk. The largest immediate driver was ai demand supports regional technology supply chains.
News & Events opportunity & risk
Critical pressure balance
China Equities
Moderate tailwind balance: U.S. disinflation supports global liquidity conditions
News & Events opportunity & risk
Critical pressure balance
Metals
Price and breadth were bearish, while fresh-event direction was strong bullish with high event risk. The combined single-day setup is balanced with elevated risk. The single-day picture diverges from the cautious medium-term regime.
Market Lens opportunity & risk
Symbols advancing
Same-session price breadth. A low reading means most tracked symbols declined during the session.
Critical pressure balance
Metals
Metals is rated cautious; verified evidence is improving, but price confirmation remains weak or incomplete, with elevated divergence.
Market Lens opportunity & risk
Symbols advancing
Same-session price breadth. A low reading means most tracked symbols declined during the session.
Critical pressure balance
Metals
The single-day was bearish with 0 advancing, 6 declining, and 1 unchanged symbols. Daily conditions are aligned with the medium-term regime. Risk was normal and the risk-adjusted daily setup was cautious.
Technical opportunity & risk
Regime at a glance
Read together with the selected-horizon technical opportunity score above.
Symbols advancing
Same-session price breadth. A low reading means most tracked symbols declined during the session.
Metals
High downside risk across this asset class
Technical opportunity & risk
Regime at a glance
Read together with the selected-horizon technical opportunity score above.
Symbols advancing
Same-session price breadth. A low reading means most tracked symbols declined during the session.
Metals
Inside the window from the July 15 close through the July 16 cutoff, fresh verified events produced a strong bullish directional balance and high event risk. The largest immediate driver was ai capex supports copper-intensive infrastructure demand.
News & Events opportunity & risk
Critical pressure balance
Metals
Moderate tailwind balance: Cooling CPI supports precious metals through rate relief
News & Events opportunity & risk
Critical pressure balance
Crypto
Price and breadth were bearish, while fresh-event direction was strong bearish with elevated event risk. The combined single-day setup is cautious with elevated risk.
Market Lens opportunity & risk
Symbols advancing
Same-session price breadth. A low reading means most tracked symbols declined during the session.
Critical pressure balance
No verified tailwind pressure for this horizon.
Crypto
Crypto is rated cautious; technical conditions are cautious while news & events evidence remains balanced, with elevated divergence.
Market Lens opportunity & risk
Symbols advancing
Same-session price breadth. A low reading means most tracked symbols declined during the session.
Critical pressure balance
Crypto
The single-day was bearish with 0 advancing, 6 declining, and 0 unchanged symbols. Daily conditions are aligned with the medium-term regime. Risk was normal and the risk-adjusted daily setup was cautious.
Technical opportunity & risk
Regime at a glance
Read together with the selected-horizon technical opportunity score above.
Symbols advancing
Same-session price breadth. A low reading means most tracked symbols declined during the session.
Crypto
High downside risk across this asset class
Technical opportunity & risk
Regime at a glance
Read together with the selected-horizon technical opportunity score above.
Symbols advancing
Same-session price breadth. A low reading means most tracked symbols declined during the session.
Crypto
Inside the window from the July 15 close through the July 16 cutoff, fresh verified events produced a strong bearish directional balance and elevated event risk. The largest immediate driver was fatf findings raise compliance and enforcement risk.
News & Events opportunity & risk
Critical pressure balance
No verified tailwind pressure for this horizon.
Crypto
Balanced / neutral evidence: Cooling CPI supports liquidity-sensitive crypto assets
News & Events opportunity & risk
Critical pressure balance
Executive market dashboard Opportunity scores, regime, volatility, and evidence-pressure distributions 11
Single-day opportunity and risk Price breadth, fresh events, and daily risk; separate from the broader regime
| # | Asset class | Direction | Risk | Daily opportunity | Breadth | Fresh-event pressure | |||
|---|---|---|---|---|---|---|---|---|---|
| Technical | News | Combined | Tailwinds | Headwinds | |||||
| 1 | Real Estate Single-day conditions turn favorable for Real Estate | Bullish | Normal | +1.3 | -2.7 | +1.3 Favorable | 83% advancing |
0
|
3
|
| 2 | Energy Single-day conditions turn favorable for Energy | Bullish | Elevated | -0.2 | +1.7 | +0.6 Favorable | 40% advancing |
3
|
1
|
| 3 | Hong Kong Equities Single-day conditions turn favorable for Hong Kong Equities | Bullish | Elevated | - | +0.6 | +0.6 Favorable | - advancing |
1
|
1
|
| 4 | China Equities Single-day conditions turn favorable for China Equities | Bullish | Normal | +0.1 | +1.2 | +0.5 Favorable | 50% advancing |
1
|
1
|
| 5 | US Equities Single-day conditions remain balanced for US Equities | Mixed | Normal | -0.1 | +2 | -0.1 Balanced | 40% advancing |
5
|
1
|
| 6 | Japan Equities Single-day conditions remain balanced for Japan Equities | Mixed | Normal | -1.4 | +1.5 | -0.2 Balanced | 0% advancing |
1
|
1
|
| 7 | Metals Single-day direction is mixed with elevated risk | Mixed | Elevated | -1.3 | +1.5 | -0.2 Balanced | 0% advancing |
2
|
1
|
| 8 | Fixed Income Single-day conditions turn cautious for Fixed Income | Bearish | Low | -0.5 | -2.6 | -0.5 Cautious | 0% advancing |
1
|
5
|
| 9 | Europe Equities Single-day bearish conditions challenge the medium-term view | Bearish | Elevated | -0.8 | -0.2 | -0.6 Cautious | 17% advancing |
1
|
2
|
| 10 | Emerging Markets Equities Single-day conditions turn cautious for Emerging Markets Equities | Bearish | Elevated | -1.3 | +0.3 | -0.7 Cautious | 0% advancing |
2
|
2
|
| 11 | Crypto Single-day conditions turn cautious for Crypto | Bearish | Elevated | -1.2 | -1.9 | -1.5 Cautious | 0% advancing |
0
|
2
|
Daily scores range from -3 to +3; risk ranges from 0 to 3. Breadth is the share of analyzed symbols advancing. Fresh-event bars use one shared daily-pressure scale.
Medium term
| # | Asset class | Trend | Volatility | Opportunity scores | News & Events pressure | |||
|---|---|---|---|---|---|---|---|---|
| Technical | News | Combined | Tailwinds | Headwinds | ||||
| 1 | US Equities Strong opportunity technical view with incomplete news validation | Uptrend | Normal | +1.5 | - | +1.5 Strong opportunity |
8
|
4
|
| 2 | Japan Equities Uptrend and news evidence reinforce opportunity | Uptrend | Normal | +1.6 | +0.5 | +1.2 Favorable |
3
|
4
|
| 3 | Real Estate Favorable technical view with incomplete news validation | Uptrend | Normal | +1.2 | - | +1.2 Favorable |
2
|
6
|
| 4 | Europe Equities Uptrend leads while news evidence stays balanced | Uptrend | Normal | +1 | -0.1 | +0.6 Favorable |
3
|
4
|
| 5 | Emerging Markets Equities Uptrend leads while news evidence stays balanced | Sideways | Normal | +0.4 | +0.2 | +0.3 Balanced |
4
|
4
|
| 6 | Energy Technical and news evidence remain broadly balanced | Sideways | Elevated | +0.1 | +0.3 | +0.2 Balanced |
3
|
2
|
| 7 | Fixed Income Balanced technical view with incomplete news validation | Sideways | Low | +0.1 | - | +0.1 Balanced |
3
|
7
|
| 8 | Hong Kong Equities Technical and news evidence remain broadly balanced | Sideways | Normal | -0.3 | +0.3 | -0.1 Balanced |
3
|
2
|
| 9 | China Equities Improving news meets weak technical confirmation | Downtrend | Mixed | -0.8 | +0.5 | -0.3 Balanced |
3
|
2
|
| 10 | Metals Improving news meets weak technical confirmation | Downtrend | Elevated | -1.4 | +0.9 | -0.5 Cautious |
5
|
4
|
| 11 | Crypto Technical weakness dominates balanced news evidence | Downtrend | Elevated | -1.4 | +0.2 | -0.8 Cautious |
3
|
5
|
Medium-term scores range from -3 to +3. Row color reflects the Combined score. Mini-bars show individual force pressure on one shared scale; the adjacent number is the force count.
How pressure is calculated
Force pressure is a signed evidence-strength measure, not a probability or expected return. Event impact = direction x event strength x exposure relevance x mechanism share. Weighted pressure = event impact x factor importance x 100. Exposure relevance combines 50% affected-symbol coverage, 30% causal directness, and 20% transmission strength. Green bars are tailwinds, red bars are headwinds, and every mini-bar uses the same scale across all assets. Exact inputs are available inside each asset's Market-force scorecard.
Market context
The medium-term Market Lens is balanced, with 4 positive, 5 balanced, and 2 cautious asset classes. US Equities, Japan Equities, Real Estate lead the opportunity ranking, while Crypto, Metals, China Equities sit at the cautious end. The clearest risks remain concentrated in crypto and metals, while reference gaps limit the News & Events contribution for Fixed Income, Real Estate, and US Equities. The largest Technical versus News & Events tensions appear in Metals, China Equities, Crypto.
Cross-asset themes Shared macro drivers and affected markets 5
China growth slowed in the second quarter as property and investment weakened 8
China reported 4.7% first-half GDP growth and 4.3% second-quarter growth. Industrial output rose 5.4%, high-tech manufacturing 13.3%, and exports 13.4%, but fixed-asset investment fell 5.7%, real-estate investment fell 18.0%, and retail sales rose only 1.3%. Across the retained universe, the mapped transmission is negative for China Equities, Emerging Markets Equities, Energy, Europe Equities, Hong Kong Equities, Japan Equities, Metals.
U.S. consumer inflation cooled sharply in June 1
The U.S. CPI fell 0.4% in June, while core CPI was unchanged; annual headline inflation slowed to 3.5% and core inflation to 2.6%. Across the retained universe, the mapped transmission is positive for China Equities, Crypto, Emerging Markets Equities, Europe Equities, Hong Kong Equities, Japan Equities, Metals.
TSMC raised its outlook as AI demand accelerated 18
TSMC reported a 77% year-over-year profit increase, raised its revenue-growth outlook to more than 40%, and set 2026 capital spending at $60 billion to $64 billion. Across the retained universe, the mapped transmission is positive for China Equities, Emerging Markets Equities, Europe Equities, Hong Kong Equities, Japan Equities, Metals.
Conflict escalation disrupted Strait of Hormuz shipping 1314
Reports described intensified attacks, reduced vessel transit, and renewed concern about shipping and energy supply through the Strait of Hormuz. Oil remained near a monthly high despite a lower settlement on July 16. Across the retained universe, the mapped transmission is positive for Energy, Metals and negative for China Equities, Crypto, Emerging Markets Equities, Europe Equities, Hong Kong Equities, Japan Equities.
Federal Reserve minutes emphasized elevated inflation and tariff-related cost pressure 7
Minutes of the June meeting described elevated inflation, higher energy and input costs, and tariff effects, while staff expected inflation to slow later but remain sticky in core components. Across the retained universe, the mapped transmission is negative for Crypto, Emerging Markets Equities, Metals.
Upcoming catalyst calendar Scheduled events and likely transmission paths 2
| When | Catalyst and transmission | Affected assets |
|---|---|---|
| Jul 23, 2026, 8:15 AM EDT | European Central Bank policy decision 11 The decision can alter European and global rate, currency, and credit expectations. | Europe Equities |
| Jul 29, 2026, 11:00 AM EDT | Bank of Japan monetary policy meeting 22 The meeting can alter yen, domestic-rate, bank, and exporter expectations. | Japan Equities |
Asset-class directory Jump directly to detailed asset intelligence 11
1 US Equities Strong opportunity technical view with incomplete news validation Uptrend +1.5 Strong opportunity
The medium-term technical regime is uptrend with normal volatility and a technical score of 1.5. The News & Events score is excluded because the branch did not pass reference validation. Cross-branch alignment is unavailable because one branch did not pass publication validation. Consolidation confidence is moderate-high.
Top 3 tailwinds
AI demand strengthened
The event affects US Equities through business asset fundamentals and the listed supplied exposures.
Event: TSMC reported a 77% year-over-year profit increase, raised its revenue-growth outlook to more than 40%, and set 2026 capital spending at $60 billion to $64 billion.
Inflation pressure eased
The event affects US Equities through inflation rates and the listed supplied exposures.
Event: The U.S. CPI fell 0.4% in June, while core CPI was unchanged; annual headline inflation slowed to 3.5% and core inflation to 2.6%.
Bank earnings strengthened
The event affects US Equities through business asset fundamentals and the listed supplied exposures.
Event: Major U.S. banks reported stronger second-quarter profits supported by trading, deal fees, loan growth, and net interest income.
Top 3 headwinds
Fed remains inflation-focused
The event affects US Equities through monetary policy liquidity and the listed supplied exposures.
Event: Minutes of the June meeting described elevated inflation, higher energy and input costs, and tariff effects, while staff expected inflation to slow later but remain sticky in core components.
Hormuz risk rose
The event affects US Equities through geopolitics trade and the listed supplied exposures.
Event: Reports described intensified attacks, reduced vessel transit, and renewed concern about shipping and energy supply through the Strait of Hormuz. Oil remained near a monthly high despite a lower settlement on July 16.
Core cost pressure persists
The event affects US Equities through business asset fundamentals and the listed supplied exposures.
Event: Final-demand PPI fell 0.3% in June and goods prices fell 1.4%, but the measure excluding food, energy, and trade services rose 0.1% and remained 5.1% above a year earlier.
Single-day detail Technical breadth, fresh-event pulse, and largest symbol moves 10
The single-day was mixed with 4 advancing, 5 declining, and 1 unchanged symbols. Daily conditions are diverging from the medium-term opportunity score of 1.5. Risk was normal and the risk-adjusted daily setup was balanced.
Inside the window from the July 15 close through the July 16 cutoff, fresh verified events produced a strong bullish directional balance and high event risk. The largest immediate driver was tsmc outlook reinforces ai capital spending.
Price and breadth were mixed, while fresh-event scoring was excluded by publication validation. The combined single-day setup is balanced with normal risk. The single-day picture diverges from the strong opportunity medium-term regime. This single-day view is partial because only one branch passed usability checks.
Fresh-event pressure leaders
Largest normalized symbol moves
Full tailwind ledger Evidence, counterpoints, pressure, and sources 11
AI demand strengthened
The event affects US Equities through business asset fundamentals and the listed supplied exposures.
Event: TSMC reported a 77% year-over-year profit increase, raised its revenue-growth outlook to more than 40%, and set 2026 capital spending at $60 billion to $64 billion.
How calculated
+27.7 = event impact +1.5 x factor weight 18% x 100. Exposure relevance = 50% symbol coverage + 30% directness + 20% transmission.
Inflation pressure eased
The event affects US Equities through inflation rates and the listed supplied exposures.
Event: The U.S. CPI fell 0.4% in June, while core CPI was unchanged; annual headline inflation slowed to 3.5% and core inflation to 2.6%.
How calculated
+20 = event impact +2 x factor weight 10% x 100. Exposure relevance = 50% symbol coverage + 30% directness + 20% transmission.
Bank earnings strengthened
The event affects US Equities through business asset fundamentals and the listed supplied exposures.
Event: Major U.S. banks reported stronger second-quarter profits supported by trading, deal fees, loan growth, and net interest income.
How calculated
+12.9 = event impact +0.7 x factor weight 18% x 100. Exposure relevance = 50% symbol coverage + 30% directness + 20% transmission.
Producer prices cooled
The event affects US Equities through inflation rates and the listed supplied exposures.
Event: Final-demand PPI fell 0.3% in June and goods prices fell 1.4%, but the measure excluding food, energy, and trade services rose 0.1% and remained 5.1% above a year earlier.
How calculated
+6.1 = event impact +0.6 x factor weight 10% x 100. Exposure relevance = 50% symbol coverage + 30% directness + 20% transmission.
Growth remained modest
The event affects US Equities through growth activity and the listed supplied exposures.
Event: The July Beige Book characterized growth as modest, employment as mostly flat to modest, wage growth as moderate, and price increases as moderate, with mixed real-estate conditions.
How calculated
+3.9 = event impact +0.3 x factor weight 12% x 100. Exposure relevance = 50% symbol coverage + 30% directness + 20% transmission.
Factory activity improved
The event affects US Equities through growth activity and the listed supplied exposures.
Event: The Philadelphia Fed reported increases in general activity, new orders, shipments, and employment, while price indexes remained elevated.
How calculated
+3.6 = event impact +0.3 x factor weight 12% x 100. Exposure relevance = 50% symbol coverage + 30% directness + 20% transmission.
Consumer demand held
The event affects US Equities through employment consumer and the listed supplied exposures.
Event: Advance retail and food-service sales were $768.6 billion, up 0.2% from May and 6.7% from a year earlier; May was revised to a 1.0% monthly increase.
How calculated
+2.5 = event impact +0.4 x factor weight 7% x 100. Exposure relevance = 50% symbol coverage + 30% directness + 20% transmission.
Claims stayed low
The event affects US Equities through employment consumer and the listed supplied exposures.
Event: Initial claims fell to 208,000 from a revised 216,000, while the four-week average was 214,250 and continuing claims were 1.805 million.
How calculated
+1.9 = event impact +0.3 x factor weight 7% x 100. Exposure relevance = 50% symbol coverage + 30% directness + 20% transmission.
9 of 10 symbols remain in medium-term uptrends.
9 of 10 symbols remain in medium-term uptrends.
Average price is 1.5% above the 50-day trend.
Average price is 1.5% above the 50-day trend.
Normal volatility supports a more orderly technical environment.
Normal volatility supports a more orderly technical environment.
Full headwind ledger Evidence, counterpoints, pressure, and sources 6
Fed remains inflation-focused
The event affects US Equities through monetary policy liquidity and the listed supplied exposures.
Event: Minutes of the June meeting described elevated inflation, higher energy and input costs, and tariff effects, while staff expected inflation to slow later but remain sticky in core components.
How calculated
-10.2 = event impact -0.8 x factor weight 13% x 100. Exposure relevance = 50% symbol coverage + 30% directness + 20% transmission.
Hormuz risk rose
The event affects US Equities through geopolitics trade and the listed supplied exposures.
Event: Reports described intensified attacks, reduced vessel transit, and renewed concern about shipping and energy supply through the Strait of Hormuz. Oil remained near a monthly high despite a lower settlement on July 16.
How calculated
-8 = event impact -2 x factor weight 4% x 100. Exposure relevance = 50% symbol coverage + 30% directness + 20% transmission.
Core cost pressure persists
The event affects US Equities through business asset fundamentals and the listed supplied exposures.
Event: Final-demand PPI fell 0.3% in June and goods prices fell 1.4%, but the measure excluding food, energy, and trade services rose 0.1% and remained 5.1% above a year earlier.
How calculated
-7.2 = event impact -0.4 x factor weight 18% x 100. Exposure relevance = 50% symbol coverage + 30% directness + 20% transmission.
Price pressure lingers
The event affects US Equities through inflation rates and the listed supplied exposures.
Event: The July Beige Book characterized growth as modest, employment as mostly flat to modest, wage growth as moderate, and price increases as moderate, with mixed real-estate conditions.
How calculated
-2.1 = event impact -0.2 x factor weight 10% x 100. Exposure relevance = 50% symbol coverage + 30% directness + 20% transmission.
The single-day produced a mixed breadth-and-move score.
The single-day produced a mixed breadth-and-move score.
Cross-sectional differences leave parts of the asset class less supportive than the headline regime.
Cross-sectional differences leave parts of the asset class less supportive than the headline regime.
Market-force scorecard Ranked News & Events transmission channels 12
Pressure methodology
Pressure is a signed evidence-strength measure, not a probability or forecast. Event impact = direction x event strength x exposure relevance x mechanism share. Weighted pressure = event impact x factor importance x 100. Expand "How calculated" beside any force for its exact components.
| Force | Direction | Factor | Pressure |
|---|---|---|---|
| AI demand strengthened 18 The event affects US Equities through business asset fundamentals and the listed supplied exposures. | Tailwind | Business Asset Fundamentals |
+27.7
How calculated
Event strength
2.227
Symbol coverage
45%
Directness
95%
Transmission
90%
Exposure relevance
0.690
Mechanism share
100%
Event impact
+1.5
Factor weight
18%
+27.7 = event impact +1.5 x factor weight 18% x 100. Exposure relevance = 50% symbol coverage + 30% directness + 20% transmission. |
| Inflation pressure eased 1 The event affects US Equities through inflation rates and the listed supplied exposures. | Tailwind | Inflation Rates |
+20
How calculated
Event strength
2.125
Symbol coverage
100%
Directness
90%
Transmission
85%
Exposure relevance
0.940
Mechanism share
100%
Event impact
+2
Factor weight
10%
+20 = event impact +2 x factor weight 10% x 100. Exposure relevance = 50% symbol coverage + 30% directness + 20% transmission. |
| Bank earnings strengthened 17 The event affects US Equities through business asset fundamentals and the listed supplied exposures. | Tailwind | Business Asset Fundamentals |
+12.9
How calculated
Event strength
1.024
Symbol coverage
53%
Directness
92%
Transmission
80%
Exposure relevance
0.701
Mechanism share
100%
Event impact
+0.7
Factor weight
18%
+12.9 = event impact +0.7 x factor weight 18% x 100. Exposure relevance = 50% symbol coverage + 30% directness + 20% transmission. |
| Fed remains inflation-focused 7 The event affects US Equities through monetary policy liquidity and the listed supplied exposures. | Headwind | Monetary Policy Liquidity |
-10.2
How calculated
Event strength
0.835
Symbol coverage
100%
Directness
90%
Transmission
85%
Exposure relevance
0.940
Mechanism share
100%
Event impact
-0.8
Factor weight
13%
-10.2 = event impact -0.8 x factor weight 13% x 100. Exposure relevance = 50% symbol coverage + 30% directness + 20% transmission. |
| Hormuz risk rose 1314 The event affects US Equities through geopolitics trade and the listed supplied exposures. | Headwind | Geopolitics Trade |
-8
How calculated
Event strength
2.325
Symbol coverage
90%
Directness
85%
Transmission
80%
Exposure relevance
0.865
Mechanism share
100%
Event impact
-2
Factor weight
4%
-8 = event impact -2 x factor weight 4% x 100. Exposure relevance = 50% symbol coverage + 30% directness + 20% transmission. |
| Core cost pressure persists 2 The event affects US Equities through business asset fundamentals and the listed supplied exposures. | Headwind | Business Asset Fundamentals |
-7.2
How calculated
Event strength
1.333
Symbol coverage
62%
Directness
75%
Transmission
65%
Exposure relevance
0.665
Mechanism share
45%
Event impact
-0.4
Factor weight
18%
-7.2 = event impact -0.4 x factor weight 18% x 100. Exposure relevance = 50% symbol coverage + 30% directness + 20% transmission. |
| Producer prices cooled 2 The event affects US Equities through inflation rates and the listed supplied exposures. | Tailwind | Inflation Rates |
+6.1
How calculated
Event strength
1.333
Symbol coverage
90%
Directness
80%
Transmission
70%
Exposure relevance
0.830
Mechanism share
55%
Event impact
+0.6
Factor weight
10%
+6.1 = event impact +0.6 x factor weight 10% x 100. Exposure relevance = 50% symbol coverage + 30% directness + 20% transmission. |
| Growth remained modest 6 The event affects US Equities through growth activity and the listed supplied exposures. | Tailwind | Growth Activity |
+3.9
How calculated
Event strength
0.758
Symbol coverage
75%
Directness
75%
Transmission
60%
Exposure relevance
0.720
Mechanism share
60%
Event impact
+0.3
Factor weight
12%
+3.9 = event impact +0.3 x factor weight 12% x 100. Exposure relevance = 50% symbol coverage + 30% directness + 20% transmission. |
| Factory activity improved 5 The event affects US Equities through growth activity and the listed supplied exposures. | Tailwind | Growth Activity |
+3.6
How calculated
Event strength
0.455
Symbol coverage
65%
Directness
70%
Transmission
60%
Exposure relevance
0.655
Mechanism share
100%
Event impact
+0.3
Factor weight
12%
+3.6 = event impact +0.3 x factor weight 12% x 100. Exposure relevance = 50% symbol coverage + 30% directness + 20% transmission. |
| Consumer demand held 3 The event affects US Equities through employment consumer and the listed supplied exposures. | Tailwind | Employment Consumer |
+2.5
How calculated
Event strength
0.501
Symbol coverage
65%
Directness
80%
Transmission
70%
Exposure relevance
0.705
Mechanism share
100%
Event impact
+0.4
Factor weight
7%
+2.5 = event impact +0.4 x factor weight 7% x 100. Exposure relevance = 50% symbol coverage + 30% directness + 20% transmission. |
| Price pressure lingers 6 The event affects US Equities through inflation rates and the listed supplied exposures. | Headwind | Inflation Rates |
-2.1
How calculated
Event strength
0.758
Symbol coverage
75%
Directness
70%
Transmission
55%
Exposure relevance
0.695
Mechanism share
40%
Event impact
-0.2
Factor weight
10%
-2.1 = event impact -0.2 x factor weight 10% x 100. Exposure relevance = 50% symbol coverage + 30% directness + 20% transmission. |
| Claims stayed low 4 The event affects US Equities through employment consumer and the listed supplied exposures. | Tailwind | Employment Consumer |
+1.9
How calculated
Event strength
0.411
Symbol coverage
65%
Directness
75%
Transmission
60%
Exposure relevance
0.670
Mechanism share
100%
Event impact
+0.3
Factor weight
7%
+1.9 = event impact +0.3 x factor weight 7% x 100. Exposure relevance = 50% symbol coverage + 30% directness + 20% transmission. |
Symbol intelligence Trend, volatility, stretch, and mapped evidence 10
US Large-Cap Index
US Large-Cap Index remains in an uptrend with normal volatility. It is near trend relative to trend. Price is 1.1% above the 50-day average and 8.3% above the 200-day average. The strongest mapped News & Events force is tsmc outlook reinforces ai capital spending.
Risk: Favorable uptrend setupUS Technology Index
US Technology Index remains in an uptrend with elevated volatility. It is near trend relative to trend. Price is 1.7% below the 50-day average and 10.5% above the 200-day average. The strongest mapped News & Events force is tsmc outlook reinforces ai capital spending.
Risk: Uptrend with mixed riskUS Equal-Weight Index
US Equal-Weight Index remains in an uptrend with normal volatility. It is near trend relative to trend. Price is 3.2% above the 50-day average and 9.2% above the 200-day average. The strongest mapped News & Events force is cooling inflation eases discount-rate pressure.
Risk: Favorable uptrend setupUS Small-Cap Index
US Small-Cap Index remains in an uptrend with normal volatility. It is near trend relative to trend. Price is 2.0% above the 50-day average and 12.8% above the 200-day average. The strongest mapped News & Events force is cooling inflation eases discount-rate pressure.
Risk: Favorable uptrend setupUS Blue-Chip Index
US Blue-Chip Index remains in an uptrend with normal volatility. It is near trend relative to trend. Price is 2.7% above the 50-day average and 8.3% above the 200-day average. The strongest mapped News & Events force is cooling inflation eases discount-rate pressure.
Risk: Favorable uptrend setupUS Semiconductor Sector
US Semiconductor Sector remains in an uptrend with high volatility. It is near trend relative to trend. Price is 4.6% below the 50-day average and 29.8% above the 200-day average. The strongest mapped News & Events force is tsmc outlook reinforces ai capital spending.
Risk: Uptrend with mixed riskUS Financial Sector
US Financial Sector remains in an uptrend with normal volatility. It is overbought relative to trend. Price is 7.2% above the 50-day average and 8.5% above the 200-day average. The strongest mapped News & Events force is cooling inflation eases discount-rate pressure.
Risk: Uptrend with mixed riskUS Industrial Sector
US Industrial Sector remains in an uptrend with normal volatility. It is near trend relative to trend. Price is 2.0% above the 50-day average and 9.2% above the 200-day average. The strongest mapped News & Events force is cooling inflation eases discount-rate pressure.
Risk: Favorable uptrend setupUS Healthcare Sector
US Healthcare Sector remains in an uptrend with normal volatility. It is overbought relative to trend. Price is 6.3% above the 50-day average and 7.7% above the 200-day average. The strongest mapped News & Events force is cooling inflation eases discount-rate pressure.
Risk: Uptrend with mixed riskUS Consumer Discretionary Sector
US Consumer Discretionary Sector is moving sideways with normal volatility. It is near trend relative to trend. Price is 0.2% above the 50-day average and 0.3% above the 200-day average. The strongest mapped News & Events force is cooling inflation eases discount-rate pressure.
Risk: Sideways, wait-and-see2 Japan Equities Uptrend and news evidence reinforce opportunity Uptrend +1.2 Favorable
The medium-term technical regime is uptrend with normal volatility and a technical score of 1.6. Verified News & Events evidence is positive overall, led by ai semiconductor demand supports japanese suppliers. Technical conditions and verified News & Events evidence are both favorable. Consolidation confidence is high.
Top 3 tailwinds
AI demand supports suppliers
The event affects Japan Equities through business asset fundamentals and the listed supplied exposures.
Event: TSMC reported a 77% year-over-year profit increase, raised its revenue-growth outlook to more than 40%, and set 2026 capital spending at $60 billion to $64 billion.
Global yields gain relief
The event affects Japan Equities through monetary policy liquidity and the listed supplied exposures.
Event: The U.S. CPI fell 0.4% in June, while core CPI was unchanged; annual headline inflation slowed to 3.5% and core inflation to 2.6%.
Yen can aid unhedged funds
The event affects Japan Equities through currency and the listed supplied exposures.
Event: The Bank of Japan maintained a policy-rate environment around 1%, leaving Japanese assets sensitive to yen, wage, and inflation transmission ahead of the July 30-31 meeting.
Top 3 headwinds
China slowdown weighs
The event affects Japan Equities through growth activity and the listed supplied exposures.
Event: China reported 4.7% first-half GDP growth and 4.3% second-quarter growth. Industrial output rose 5.4%, high-tech manufacturing 13.3%, and exports 13.4%, but fixed-asset investment fell 5.7%, real-estate investment fell 18.0%, and retail sales rose only 1.3%.
Energy import risk rose
The event affects Japan Equities through supply demand and the listed supplied exposures.
Event: Reports described intensified attacks, reduced vessel transit, and renewed concern about shipping and energy supply through the Strait of Hormuz. Oil remained near a monthly high despite a lower settlement on July 16.
BOJ normalization risk
The event affects Japan Equities through monetary policy liquidity and the listed supplied exposures.
Event: The Bank of Japan maintained a policy-rate environment around 1%, leaving Japanese assets sensitive to yen, wage, and inflation transmission ahead of the July 30-31 meeting.
Single-day detail Technical breadth, fresh-event pulse, and largest symbol moves 5
The single-day was bearish with 0 advancing, 5 declining, and 0 unchanged symbols. This conflicts with the medium-term opportunity score of 1.6. Risk was normal and the risk-adjusted daily setup was cautious.
Inside the window from the July 15 close through the July 16 cutoff, fresh verified events produced a strong bullish directional balance and elevated event risk. The largest immediate driver was ai semiconductor demand supports japanese suppliers.
Price and breadth were bearish, while fresh-event direction was strong bullish with elevated event risk. The combined single-day setup is balanced with normal risk. The single-day picture diverges from the favorable medium-term regime.
Fresh-event pressure leaders
Largest normalized symbol moves
Full tailwind ledger Evidence, counterpoints, pressure, and sources 4
AI demand supports suppliers
The event affects Japan Equities through business asset fundamentals and the listed supplied exposures.
Event: TSMC reported a 77% year-over-year profit increase, raised its revenue-growth outlook to more than 40%, and set 2026 capital spending at $60 billion to $64 billion.
How calculated
+29 = event impact +1.7 x factor weight 17% x 100. Exposure relevance = 50% symbol coverage + 30% directness + 20% transmission.
Global yields gain relief
The event affects Japan Equities through monetary policy liquidity and the listed supplied exposures.
Event: The U.S. CPI fell 0.4% in June, while core CPI was unchanged; annual headline inflation slowed to 3.5% and core inflation to 2.6%.
How calculated
+20.4 = event impact +1.6 x factor weight 13% x 100. Exposure relevance = 50% symbol coverage + 30% directness + 20% transmission.
Yen can aid unhedged funds
The event affects Japan Equities through currency and the listed supplied exposures.
Event: The Bank of Japan maintained a policy-rate environment around 1%, leaving Japanese assets sensitive to yen, wage, and inflation transmission ahead of the July 30-31 meeting.
How calculated
+1.2 = event impact +0.1 x factor weight 10% x 100. Exposure relevance = 50% symbol coverage + 30% directness + 20% transmission.
5 of 5 symbols remain in medium-term uptrends.
5 of 5 symbols remain in medium-term uptrends.
Full headwind ledger Evidence, counterpoints, pressure, and sources 5
China slowdown weighs
The event affects Japan Equities through growth activity and the listed supplied exposures.
Event: China reported 4.7% first-half GDP growth and 4.3% second-quarter growth. Industrial output rose 5.4%, high-tech manufacturing 13.3%, and exports 13.4%, but fixed-asset investment fell 5.7%, real-estate investment fell 18.0%, and retail sales rose only 1.3%.
How calculated
-18.4 = event impact -1.5 x factor weight 12% x 100. Exposure relevance = 50% symbol coverage + 30% directness + 20% transmission.
Energy import risk rose
The event affects Japan Equities through supply demand and the listed supplied exposures.
Event: Reports described intensified attacks, reduced vessel transit, and renewed concern about shipping and energy supply through the Strait of Hormuz. Oil remained near a monthly high despite a lower settlement on July 16.
How calculated
-6.4 = event impact -2.1 x factor weight 3% x 100. Exposure relevance = 50% symbol coverage + 30% directness + 20% transmission.
BOJ normalization risk
The event affects Japan Equities through monetary policy liquidity and the listed supplied exposures.
Event: The Bank of Japan maintained a policy-rate environment around 1%, leaving Japanese assets sensitive to yen, wage, and inflation transmission ahead of the July 30-31 meeting.
How calculated
-4.9 = event impact -0.4 x factor weight 13% x 100. Exposure relevance = 50% symbol coverage + 30% directness + 20% transmission.
Yen can pressure exporters
The event affects Japan Equities through currency and the listed supplied exposures.
Event: The Bank of Japan maintained a policy-rate environment around 1%, leaving Japanese assets sensitive to yen, wage, and inflation transmission ahead of the July 30-31 meeting.
How calculated
-1.4 = event impact -0.1 x factor weight 10% x 100. Exposure relevance = 50% symbol coverage + 30% directness + 20% transmission.
The single-day produced a bearish breadth-and-move score.
The single-day produced a bearish breadth-and-move score.
Market-force scorecard Ranked News & Events transmission channels 7
Pressure methodology
Pressure is a signed evidence-strength measure, not a probability or forecast. Event impact = direction x event strength x exposure relevance x mechanism share. Weighted pressure = event impact x factor importance x 100. Expand "How calculated" beside any force for its exact components.
| Force | Direction | Factor | Pressure |
|---|---|---|---|
| AI demand supports suppliers 18 The event affects Japan Equities through business asset fundamentals and the listed supplied exposures. | Tailwind | Business Asset Fundamentals |
+29
How calculated
Event strength
2.227
Symbol coverage
85%
Directness
70%
Transmission
65%
Exposure relevance
0.765
Mechanism share
100%
Event impact
+1.7
Factor weight
17%
+29 = event impact +1.7 x factor weight 17% x 100. Exposure relevance = 50% symbol coverage + 30% directness + 20% transmission. |
| Global yields gain relief 1 The event affects Japan Equities through monetary policy liquidity and the listed supplied exposures. | Tailwind | Monetary Policy Liquidity |
+20.4
How calculated
Event strength
2.125
Symbol coverage
100%
Directness
50%
Transmission
45%
Exposure relevance
0.740
Mechanism share
100%
Event impact
+1.6
Factor weight
13%
+20.4 = event impact +1.6 x factor weight 13% x 100. Exposure relevance = 50% symbol coverage + 30% directness + 20% transmission. |
| China slowdown weighs 8 The event affects Japan Equities through growth activity and the listed supplied exposures. | Headwind | Growth Activity |
-18.4
How calculated
Event strength
2.300
Symbol coverage
65%
Directness
70%
Transmission
65%
Exposure relevance
0.665
Mechanism share
100%
Event impact
-1.5
Factor weight
12%
-18.4 = event impact -1.5 x factor weight 12% x 100. Exposure relevance = 50% symbol coverage + 30% directness + 20% transmission. |
| Energy import risk rose 1314 The event affects Japan Equities through supply demand and the listed supplied exposures. | Headwind | Supply Demand |
-6.4
How calculated
Event strength
2.325
Symbol coverage
100%
Directness
85%
Transmission
80%
Exposure relevance
0.915
Mechanism share
100%
Event impact
-2.1
Factor weight
3%
-6.4 = event impact -2.1 x factor weight 3% x 100. Exposure relevance = 50% symbol coverage + 30% directness + 20% transmission. |
| BOJ normalization risk 1222 The event affects Japan Equities through monetary policy liquidity and the listed supplied exposures. | Headwind | Monetary Policy Liquidity |
-4.9
How calculated
Event strength
0.825
Symbol coverage
85%
Directness
85%
Transmission
75%
Exposure relevance
0.830
Mechanism share
55%
Event impact
-0.4
Factor weight
13%
-4.9 = event impact -0.4 x factor weight 13% x 100. Exposure relevance = 50% symbol coverage + 30% directness + 20% transmission. |
| Yen can pressure exporters 1222 The event affects Japan Equities through currency and the listed supplied exposures. | Headwind | Currency |
-1.4
How calculated
Event strength
0.825
Symbol coverage
65%
Directness
75%
Transmission
65%
Exposure relevance
0.680
Mechanism share
25%
Event impact
-0.1
Factor weight
10%
-1.4 = event impact -0.1 x factor weight 10% x 100. Exposure relevance = 50% symbol coverage + 30% directness + 20% transmission. |
| Yen can aid unhedged funds 1222 The event affects Japan Equities through currency and the listed supplied exposures. | Tailwind | Currency |
+1.2
How calculated
Event strength
0.825
Symbol coverage
85%
Directness
70%
Transmission
55%
Exposure relevance
0.745
Mechanism share
20%
Event impact
+0.1
Factor weight
10%
+1.2 = event impact +0.1 x factor weight 10% x 100. Exposure relevance = 50% symbol coverage + 30% directness + 20% transmission. |
Symbol intelligence Trend, volatility, stretch, and mapped evidence 5
Japan Broad Market
Japan Broad Market remains in an uptrend with normal volatility. It is near trend relative to trend. Price is 0.5% below the 50-day average and 7.4% above the 200-day average. The strongest mapped News & Events force is ai semiconductor demand supports japanese suppliers.
Risk: Favorable uptrend setupJapan Small-Cap Equity
Japan Small-Cap Equity remains in an uptrend with normal volatility. It is near trend relative to trend. Price is 0.9% above the 50-day average and 8.9% above the 200-day average. The strongest mapped News & Events force is ai semiconductor demand supports japanese suppliers.
Risk: Favorable uptrend setupJapan Hedged Equity
Japan Hedged Equity remains in an uptrend with normal volatility. It is near trend relative to trend. Price is 2.4% above the 50-day average and 13.8% above the 200-day average. The strongest mapped News & Events force is ai semiconductor demand supports japanese suppliers.
Risk: Favorable uptrend setupJapan Value Equity
Japan Value Equity remains in an uptrend with normal volatility. It is near trend relative to trend. Price is 1.8% above the 50-day average and 9.6% above the 200-day average. The strongest mapped News & Events force is u.s. disinflation eases global yield pressure.
Risk: Favorable uptrend setupJapan JPX-Nikkei 400
Japan JPX-Nikkei 400 remains in an uptrend with normal volatility. It is near trend relative to trend. Price is 0.4% below the 50-day average and 7.3% above the 200-day average. The strongest mapped News & Events force is ai semiconductor demand supports japanese suppliers.
Risk: Favorable uptrend setupAsset catalysts Scheduled events and transmission paths 1
| When | Catalyst and transmission |
|---|---|
| Jul 29, 2026, 11:00 AM EDT | Bank of Japan monetary policy meeting 22 The meeting can alter yen, domestic-rate, bank, and exporter expectations. |
3 Real Estate Favorable technical view with incomplete news validation Uptrend +1.2 Favorable
The medium-term technical regime is uptrend with normal volatility and a technical score of 1.2. The News & Events score is excluded because the branch did not pass reference validation. Cross-branch alignment is unavailable because one branch did not pass publication validation. Consolidation confidence is moderate-high.
Top 3 tailwinds
Inflation relief helps REITs
The event affects Real Estate through inflation rates and the listed supplied exposures.
Event: The U.S. CPI fell 0.4% in June, while core CPI was unchanged; annual headline inflation slowed to 3.5% and core inflation to 2.6%.
PPI relief helps rates
The event affects Real Estate through inflation rates and the listed supplied exposures.
Event: Final-demand PPI fell 0.3% in June and goods prices fell 1.4%, but the measure excluding food, energy, and trade services rose 0.1% and remained 5.1% above a year earlier.
5 of 6 symbols remain in medium-term uptrends.
5 of 6 symbols remain in medium-term uptrends.
Top 3 headwinds
Energy risk delays relief
The event affects Real Estate through inflation rates and the listed supplied exposures.
Event: Reports described intensified attacks, reduced vessel transit, and renewed concern about shipping and energy supply through the Strait of Hormuz. Oil remained near a monthly high despite a lower settlement on July 16.
Fed restraint weighs
The event affects Real Estate through monetary policy liquidity and the listed supplied exposures.
Event: Minutes of the June meeting described elevated inflation, higher energy and input costs, and tariff effects, while staff expected inflation to slow later but remain sticky in core components.
Mortgage rates climbed
The event affects Real Estate through credit financial conditions and the listed supplied exposures.
Event: Freddie Mac reported the average 30-year fixed mortgage rate at 6.55%, up from 6.49% the prior week; the 15-year rate was 5.93%.
Single-day detail Technical breadth, fresh-event pulse, and largest symbol moves 6
The single-day was bullish with 5 advancing, 1 declining, and 0 unchanged symbols. Daily conditions are aligned with the medium-term regime. Risk was normal and the risk-adjusted daily setup was favorable.
Inside the window from the July 15 close through the July 16 cutoff, fresh verified events produced a strong bearish directional balance and high event risk. The largest immediate driver was energy shock risk can delay financing relief.
Price and breadth were bullish, while fresh-event scoring was excluded by publication validation. The combined single-day setup is favorable with normal risk. This single-day view is partial because only one branch passed usability checks.
Fresh-event pressure leaders
Largest normalized symbol moves
Full tailwind ledger Evidence, counterpoints, pressure, and sources 5
Inflation relief helps REITs
The event affects Real Estate through inflation rates and the listed supplied exposures.
Event: The U.S. CPI fell 0.4% in June, while core CPI was unchanged; annual headline inflation slowed to 3.5% and core inflation to 2.6%.
How calculated
+16 = event impact +2 x factor weight 8% x 100. Exposure relevance = 50% symbol coverage + 30% directness + 20% transmission.
PPI relief helps rates
The event affects Real Estate through inflation rates and the listed supplied exposures.
Event: Final-demand PPI fell 0.3% in June and goods prices fell 1.4%, but the measure excluding food, energy, and trade services rose 0.1% and remained 5.1% above a year earlier.
How calculated
+4.6 = event impact +0.6 x factor weight 8% x 100. Exposure relevance = 50% symbol coverage + 30% directness + 20% transmission.
5 of 6 symbols remain in medium-term uptrends.
5 of 6 symbols remain in medium-term uptrends.
Average price is 2.2% above the 50-day trend.
Average price is 2.2% above the 50-day trend.
Normal volatility supports a more orderly technical environment.
Normal volatility supports a more orderly technical environment.
Full headwind ledger Evidence, counterpoints, pressure, and sources 8
Energy risk delays relief
The event affects Real Estate through inflation rates and the listed supplied exposures.
Event: Reports described intensified attacks, reduced vessel transit, and renewed concern about shipping and energy supply through the Strait of Hormuz. Oil remained near a monthly high despite a lower settlement on July 16.
How calculated
-15.4 = event impact -1.9 x factor weight 8% x 100. Exposure relevance = 50% symbol coverage + 30% directness + 20% transmission.
Fed restraint weighs
The event affects Real Estate through monetary policy liquidity and the listed supplied exposures.
Event: Minutes of the June meeting described elevated inflation, higher energy and input costs, and tariff effects, while staff expected inflation to slow later but remain sticky in core components.
How calculated
-14.5 = event impact -0.8 x factor weight 18% x 100. Exposure relevance = 50% symbol coverage + 30% directness + 20% transmission.
Mortgage rates climbed
The event affects Real Estate through credit financial conditions and the listed supplied exposures.
Event: Freddie Mac reported the average 30-year fixed mortgage rate at 6.55%, up from 6.49% the prior week; the 15-year rate was 5.93%.
How calculated
-14.1 = event impact -0.9 x factor weight 16% x 100. Exposure relevance = 50% symbol coverage + 30% directness + 20% transmission.
Home contracts weakened
The event affects Real Estate through business asset fundamentals and the listed supplied exposures.
Event: Pending home sales decreased 5.4% from May and 0.3% from a year earlier, with declines across all four U.S. regions.
How calculated
-13.8 = event impact -1.2 x factor weight 12% x 100. Exposure relevance = 50% symbol coverage + 30% directness + 20% transmission.
Property conditions mixed
The event affects Real Estate through business asset fundamentals and the listed supplied exposures.
Event: The July Beige Book characterized growth as modest, employment as mostly flat to modest, wage growth as moderate, and price increases as moderate, with mixed real-estate conditions.
How calculated
-6.6 = event impact -0.6 x factor weight 12% x 100. Exposure relevance = 50% symbol coverage + 30% directness + 20% transmission.
Property costs stay firm
The event affects Real Estate through business asset fundamentals and the listed supplied exposures.
Event: Final-demand PPI fell 0.3% in June and goods prices fell 1.4%, but the measure excluding food, energy, and trade services rose 0.1% and remained 5.1% above a year earlier.
How calculated
-4.9 = event impact -0.4 x factor weight 12% x 100. Exposure relevance = 50% symbol coverage + 30% directness + 20% transmission.
1 of 6 symbols remain in medium-term downtrends.
1 of 6 symbols remain in medium-term downtrends.
Cross-sectional differences leave parts of the asset class less supportive than the headline regime.
Cross-sectional differences leave parts of the asset class less supportive than the headline regime.
Market-force scorecard Ranked News & Events transmission channels 8
Pressure methodology
Pressure is a signed evidence-strength measure, not a probability or forecast. Event impact = direction x event strength x exposure relevance x mechanism share. Weighted pressure = event impact x factor importance x 100. Expand "How calculated" beside any force for its exact components.
| Force | Direction | Factor | Pressure |
|---|---|---|---|
| Inflation relief helps REITs 1 The event affects Real Estate through inflation rates and the listed supplied exposures. | Tailwind | Inflation Rates |
+16
How calculated
Event strength
2.125
Symbol coverage
100%
Directness
90%
Transmission
85%
Exposure relevance
0.940
Mechanism share
100%
Event impact
+2
Factor weight
8%
+16 = event impact +2 x factor weight 8% x 100. Exposure relevance = 50% symbol coverage + 30% directness + 20% transmission. |
| Energy risk delays relief 1314 The event affects Real Estate through inflation rates and the listed supplied exposures. | Headwind | Inflation Rates |
-15.4
How calculated
Event strength
2.325
Symbol coverage
100%
Directness
70%
Transmission
60%
Exposure relevance
0.830
Mechanism share
100%
Event impact
-1.9
Factor weight
8%
-15.4 = event impact -1.9 x factor weight 8% x 100. Exposure relevance = 50% symbol coverage + 30% directness + 20% transmission. |
| Fed restraint weighs 7 The event affects Real Estate through monetary policy liquidity and the listed supplied exposures. | Headwind | Monetary Policy Liquidity |
-14.5
How calculated
Event strength
0.835
Symbol coverage
100%
Directness
95%
Transmission
90%
Exposure relevance
0.965
Mechanism share
100%
Event impact
-0.8
Factor weight
18%
-14.5 = event impact -0.8 x factor weight 18% x 100. Exposure relevance = 50% symbol coverage + 30% directness + 20% transmission. |
| Mortgage rates climbed 15 The event affects Real Estate through credit financial conditions and the listed supplied exposures. | Headwind | Credit Financial Conditions |
-14.1
How calculated
Event strength
1.115
Symbol coverage
65%
Directness
95%
Transmission
90%
Exposure relevance
0.790
Mechanism share
100%
Event impact
-0.9
Factor weight
16%
-14.1 = event impact -0.9 x factor weight 16% x 100. Exposure relevance = 50% symbol coverage + 30% directness + 20% transmission. |
| Home contracts weakened 16 The event affects Real Estate through business asset fundamentals and the listed supplied exposures. | Headwind | Business Asset Fundamentals |
-13.8
How calculated
Event strength
1.332
Symbol coverage
85%
Directness
90%
Transmission
85%
Exposure relevance
0.865
Mechanism share
100%
Event impact
-1.2
Factor weight
12%
-13.8 = event impact -1.2 x factor weight 12% x 100. Exposure relevance = 50% symbol coverage + 30% directness + 20% transmission. |
| Property conditions mixed 6 The event affects Real Estate through business asset fundamentals and the listed supplied exposures. | Headwind | Business Asset Fundamentals |
-6.6
How calculated
Event strength
0.758
Symbol coverage
85%
Directness
65%
Transmission
55%
Exposure relevance
0.730
Mechanism share
100%
Event impact
-0.6
Factor weight
12%
-6.6 = event impact -0.6 x factor weight 12% x 100. Exposure relevance = 50% symbol coverage + 30% directness + 20% transmission. |
| Property costs stay firm 2 The event affects Real Estate through business asset fundamentals and the listed supplied exposures. | Headwind | Business Asset Fundamentals |
-4.9
How calculated
Event strength
1.333
Symbol coverage
75%
Directness
65%
Transmission
55%
Exposure relevance
0.680
Mechanism share
45%
Event impact
-0.4
Factor weight
12%
-4.9 = event impact -0.4 x factor weight 12% x 100. Exposure relevance = 50% symbol coverage + 30% directness + 20% transmission. |
| PPI relief helps rates 2 The event affects Real Estate through inflation rates and the listed supplied exposures. | Tailwind | Inflation Rates |
+4.6
How calculated
Event strength
1.333
Symbol coverage
85%
Directness
75%
Transmission
65%
Exposure relevance
0.780
Mechanism share
55%
Event impact
+0.6
Factor weight
8%
+4.6 = event impact +0.6 x factor weight 8% x 100. Exposure relevance = 50% symbol coverage + 30% directness + 20% transmission. |
Symbol intelligence Trend, volatility, stretch, and mapped evidence 6
US Real Estate
US Real Estate remains in an uptrend with normal volatility. It is near trend relative to trend. Price is 4.0% above the 50-day average and 9.9% above the 200-day average. The strongest mapped News & Events force is cooling inflation supports rate-sensitive real estate.
Risk: Favorable uptrend setupGlobal Real Estate
Global Real Estate remains in an uptrend with normal volatility. It is near trend relative to trend. Price is 4.0% above the 50-day average and 10.2% above the 200-day average. The strongest mapped News & Events force is cooling inflation supports rate-sensitive real estate.
Risk: Favorable uptrend setupData Center and Digital REITs
Data Center and Digital REITs remains in a downtrend with normal volatility. It is oversold relative to trend. Price is 9.0% below the 50-day average and 3.8% below the 200-day average. The strongest mapped News & Events force is cooling inflation supports rate-sensitive real estate.
Risk: Downtrend, possible rebound riskUS Real Estate Sector
US Real Estate Sector remains in an uptrend with normal volatility. It is near trend relative to trend. Price is 2.9% above the 50-day average and 8.7% above the 200-day average. The strongest mapped News & Events force is cooling inflation supports rate-sensitive real estate.
Risk: Favorable uptrend setupMortgage Real Estate
Mortgage Real Estate remains in an uptrend with normal volatility. It is near trend relative to trend. Price is 4.6% above the 50-day average and 5.4% above the 200-day average. The strongest mapped News & Events force is cooling inflation supports rate-sensitive real estate.
Risk: Favorable uptrend setupResidential and Specialized REITs
Residential and Specialized REITs remains in an uptrend with normal volatility. It is overbought relative to trend. Price is 6.6% above the 50-day average and 13.6% above the 200-day average. The strongest mapped News & Events force is cooling inflation supports rate-sensitive real estate.
Risk: Uptrend with mixed risk4 Europe Equities Uptrend leads while news evidence stays balanced Uptrend +0.6 Favorable
The medium-term technical regime is uptrend with normal volatility and a technical score of 1.0. Verified News & Events evidence is neutral overall, led by china slowdown weighs on export-sensitive sectors. Technical conditions are favorable while News & Events evidence remains balanced. Consolidation confidence is moderate-high.
Top 3 tailwinds
AI demand supports suppliers
The event affects Europe Equities through business asset fundamentals and the listed supplied exposures.
Event: TSMC reported a 77% year-over-year profit increase, raised its revenue-growth outlook to more than 40%, and set 2026 capital spending at $60 billion to $64 billion.
Global rate pressure eased
The event affects Europe Equities through monetary policy liquidity and the listed supplied exposures.
Event: The U.S. CPI fell 0.4% in June, while core CPI was unchanged; annual headline inflation slowed to 3.5% and core inflation to 2.6%.
Euro inflation cooled
The event affects Europe Equities through inflation rates and the listed supplied exposures.
Event: Euro-area annual inflation eased to 2.8% in June from 3.2% in May; energy inflation remained elevated at 8.7% and services inflation was 3.2%.
Top 3 headwinds
China growth slowed
The event affects Europe Equities through growth activity and the listed supplied exposures.
Event: China reported 4.7% first-half GDP growth and 4.3% second-quarter growth. Industrial output rose 5.4%, high-tech manufacturing 13.3%, and exports 13.4%, but fixed-asset investment fell 5.7%, real-estate investment fell 18.0%, and retail sales rose only 1.3%.
Energy and trade risk rose
The event affects Europe Equities through geopolitics trade and the listed supplied exposures.
Event: Reports described intensified attacks, reduced vessel transit, and renewed concern about shipping and energy supply through the Strait of Hormuz. Oil remained near a monthly high despite a lower settlement on July 16.
ECB hike risk remains
The event affects Europe Equities through monetary policy liquidity and the listed supplied exposures.
Event: A Reuters economist poll expected the ECB to hold its policy rate at 2.25% on July 23, while renewed energy-price pressure maintained the possibility of a September increase.
Single-day detail Technical breadth, fresh-event pulse, and largest symbol moves 6
The single-day was bearish with 1 advancing, 5 declining, and 0 unchanged symbols. This conflicts with the medium-term opportunity score of 1.0. Risk was low and the risk-adjusted daily setup was cautious.
Inside the window from the July 15 close through the July 16 cutoff, fresh verified events produced a mixed directional balance and high event risk. The largest immediate driver was hormuz disruption raises energy and trade costs.
Price and breadth were bearish, while fresh-event direction was mixed with high event risk. The combined single-day setup is cautious with elevated risk. The single-day picture conflicts with the favorable medium-term regime.
Fresh-event pressure leaders
Largest normalized symbol moves
Full tailwind ledger Evidence, counterpoints, pressure, and sources 4
AI demand supports suppliers
The event affects Europe Equities through business asset fundamentals and the listed supplied exposures.
Event: TSMC reported a 77% year-over-year profit increase, raised its revenue-growth outlook to more than 40%, and set 2026 capital spending at $60 billion to $64 billion.
How calculated
+22.3 = event impact +1.3 x factor weight 17% x 100. Exposure relevance = 50% symbol coverage + 30% directness + 20% transmission.
Global rate pressure eased
The event affects Europe Equities through monetary policy liquidity and the listed supplied exposures.
Event: The U.S. CPI fell 0.4% in June, while core CPI was unchanged; annual headline inflation slowed to 3.5% and core inflation to 2.6%.
How calculated
+18.9 = event impact +1.6 x factor weight 12% x 100. Exposure relevance = 50% symbol coverage + 30% directness + 20% transmission.
Euro inflation cooled
The event affects Europe Equities through inflation rates and the listed supplied exposures.
Event: Euro-area annual inflation eased to 2.8% in June from 3.2% in May; energy inflation remained elevated at 8.7% and services inflation was 3.2%.
How calculated
+7.1 = event impact +0.9 x factor weight 8% x 100. Exposure relevance = 50% symbol coverage + 30% directness + 20% transmission.
4 of 6 symbols remain in medium-term uptrends.
4 of 6 symbols remain in medium-term uptrends.
Full headwind ledger Evidence, counterpoints, pressure, and sources 5
China growth slowed
The event affects Europe Equities through growth activity and the listed supplied exposures.
Event: China reported 4.7% first-half GDP growth and 4.3% second-quarter growth. Industrial output rose 5.4%, high-tech manufacturing 13.3%, and exports 13.4%, but fixed-asset investment fell 5.7%, real-estate investment fell 18.0%, and retail sales rose only 1.3%.
How calculated
-24.6 = event impact -1.8 x factor weight 14% x 100. Exposure relevance = 50% symbol coverage + 30% directness + 20% transmission.
Energy and trade risk rose
The event affects Europe Equities through geopolitics trade and the listed supplied exposures.
Event: Reports described intensified attacks, reduced vessel transit, and renewed concern about shipping and energy supply through the Strait of Hormuz. Oil remained near a monthly high despite a lower settlement on July 16.
How calculated
-17.5 = event impact -2.2 x factor weight 8% x 100. Exposure relevance = 50% symbol coverage + 30% directness + 20% transmission.
ECB hike risk remains
The event affects Europe Equities through monetary policy liquidity and the listed supplied exposures.
Event: A Reuters economist poll expected the ECB to hold its policy rate at 2.25% on July 23, while renewed energy-price pressure maintained the possibility of a September increase.
How calculated
-8.8 = event impact -0.7 x factor weight 12% x 100. Exposure relevance = 50% symbol coverage + 30% directness + 20% transmission.
Industry output softened
The event affects Europe Equities through growth activity and the listed supplied exposures.
Event: Euro-area industrial production declined 0.2% from the previous month in May.
How calculated
-5 = event impact -0.4 x factor weight 14% x 100. Exposure relevance = 50% symbol coverage + 30% directness + 20% transmission.
The single-day produced a bearish breadth-and-move score.
The single-day produced a bearish breadth-and-move score.
Market-force scorecard Ranked News & Events transmission channels 7
Pressure methodology
Pressure is a signed evidence-strength measure, not a probability or forecast. Event impact = direction x event strength x exposure relevance x mechanism share. Weighted pressure = event impact x factor importance x 100. Expand "How calculated" beside any force for its exact components.
| Force | Direction | Factor | Pressure |
|---|---|---|---|
| China growth slowed 8 The event affects Europe Equities through growth activity and the listed supplied exposures. | Headwind | Growth Activity |
-24.6
How calculated
Event strength
2.300
Symbol coverage
85%
Directness
70%
Transmission
65%
Exposure relevance
0.765
Mechanism share
100%
Event impact
-1.8
Factor weight
14%
-24.6 = event impact -1.8 x factor weight 14% x 100. Exposure relevance = 50% symbol coverage + 30% directness + 20% transmission. |
| AI demand supports suppliers 18 The event affects Europe Equities through business asset fundamentals and the listed supplied exposures. | Tailwind | Business Asset Fundamentals |
+22.3
How calculated
Event strength
2.227
Symbol coverage
75%
Directness
45%
Transmission
40%
Exposure relevance
0.590
Mechanism share
100%
Event impact
+1.3
Factor weight
17%
+22.3 = event impact +1.3 x factor weight 17% x 100. Exposure relevance = 50% symbol coverage + 30% directness + 20% transmission. |
| Global rate pressure eased 1 The event affects Europe Equities through monetary policy liquidity and the listed supplied exposures. | Tailwind | Monetary Policy Liquidity |
+18.9
How calculated
Event strength
2.125
Symbol coverage
100%
Directness
50%
Transmission
45%
Exposure relevance
0.740
Mechanism share
100%
Event impact
+1.6
Factor weight
12%
+18.9 = event impact +1.6 x factor weight 12% x 100. Exposure relevance = 50% symbol coverage + 30% directness + 20% transmission. |
| Energy and trade risk rose 1314 The event affects Europe Equities through geopolitics trade and the listed supplied exposures. | Headwind | Geopolitics Trade |
-17.5
How calculated
Event strength
2.325
Symbol coverage
100%
Directness
90%
Transmission
85%
Exposure relevance
0.940
Mechanism share
100%
Event impact
-2.2
Factor weight
8%
-17.5 = event impact -2.2 x factor weight 8% x 100. Exposure relevance = 50% symbol coverage + 30% directness + 20% transmission. |
| ECB hike risk remains 11 The event affects Europe Equities through monetary policy liquidity and the listed supplied exposures. | Headwind | Monetary Policy Liquidity |
-8.8
How calculated
Event strength
0.847
Symbol coverage
85%
Directness
90%
Transmission
85%
Exposure relevance
0.865
Mechanism share
100%
Event impact
-0.7
Factor weight
12%
-8.8 = event impact -0.7 x factor weight 12% x 100. Exposure relevance = 50% symbol coverage + 30% directness + 20% transmission. |
| Euro inflation cooled 9 The event affects Europe Equities through inflation rates and the listed supplied exposures. | Tailwind | Inflation Rates |
+7.1
How calculated
Event strength
0.943
Symbol coverage
100%
Directness
90%
Transmission
85%
Exposure relevance
0.940
Mechanism share
100%
Event impact
+0.9
Factor weight
8%
+7.1 = event impact +0.9 x factor weight 8% x 100. Exposure relevance = 50% symbol coverage + 30% directness + 20% transmission. |
| Industry output softened 10 The event affects Europe Equities through growth activity and the listed supplied exposures. | Headwind | Growth Activity |
-5
How calculated
Event strength
0.491
Symbol coverage
70%
Directness
80%
Transmission
70%
Exposure relevance
0.730
Mechanism share
100%
Event impact
-0.4
Factor weight
14%
-5 = event impact -0.4 x factor weight 14% x 100. Exposure relevance = 50% symbol coverage + 30% directness + 20% transmission. |
Symbol intelligence Trend, volatility, stretch, and mapped evidence 6
Europe Broad Market
Europe Broad Market remains in an uptrend with normal volatility. It is near trend relative to trend. Price is 1.5% above the 50-day average and 6.3% above the 200-day average. The strongest mapped News & Events force is china slowdown weighs on export-sensitive sectors.
Risk: Favorable uptrend setupSwitzerland Index
Switzerland Index remains in an uptrend with normal volatility. It is near trend relative to trend. Price is 2.3% above the 50-day average and 6.4% above the 200-day average. The strongest mapped News & Events force is china slowdown weighs on export-sensitive sectors.
Risk: Favorable uptrend setupUnited Kingdom Index
United Kingdom Index remains in an uptrend with normal volatility. It is near trend relative to trend. Price is 1.8% above the 50-day average and 5.7% above the 200-day average. The strongest mapped News & Events force is u.s. disinflation supports global rate relief.
Risk: Favorable uptrend setupEurozone Equity Index
Eurozone Equity Index remains in an uptrend with normal volatility. It is near trend relative to trend. Price is 0.9% above the 50-day average and 6.3% above the 200-day average. The strongest mapped News & Events force is china slowdown weighs on export-sensitive sectors.
Risk: Favorable uptrend setupGermany Index
Germany Index is moving sideways with normal volatility. It is near trend relative to trend. Price is 1.0% below the 50-day average and 0.1% above the 200-day average. The strongest mapped News & Events force is china slowdown weighs on export-sensitive sectors.
Risk: Sideways, wait-and-seeFrance Index
France Index is moving sideways with normal volatility. It is near trend relative to trend. Price is 0.7% above the 50-day average and 2.5% above the 200-day average. The strongest mapped News & Events force is china slowdown weighs on export-sensitive sectors.
Risk: Sideways, wait-and-seeAsset catalysts Scheduled events and transmission paths 1
| When | Catalyst and transmission |
|---|---|
| Jul 23, 2026, 8:15 AM EDT | European Central Bank policy decision 11 The decision can alter European and global rate, currency, and credit expectations. |
5 Emerging Markets Equities Uptrend leads while news evidence stays balanced Sideways +0.3 Balanced
The medium-term technical regime is sideways with normal volatility and a technical score of 0.4. Verified News & Events evidence is neutral overall, led by tsmc outlook strongly supports taiwan technology exposure. Technical conditions are favorable while News & Events evidence remains balanced. Consolidation confidence is moderate-high.
Top 3 tailwinds
TSMC supports Taiwan tech
The event affects Emerging Markets Equities through business asset fundamentals and the listed supplied exposures.
Event: TSMC reported a 77% year-over-year profit increase, raised its revenue-growth outlook to more than 40%, and set 2026 capital spending at $60 billion to $64 billion.
U.S. rate pressure eased
The event affects Emerging Markets Equities through monetary policy liquidity and the listed supplied exposures.
Event: The U.S. CPI fell 0.4% in June, while core CPI was unchanged; annual headline inflation slowed to 3.5% and core inflation to 2.6%.
High-tech output supports Asia
The event affects Emerging Markets Equities through business asset fundamentals and the listed supplied exposures.
Event: China reported 4.7% first-half GDP growth and 4.3% second-quarter growth. Industrial output rose 5.4%, high-tech manufacturing 13.3%, and exports 13.4%, but fixed-asset investment fell 5.7%, real-estate investment fell 18.0%, and retail sales rose only 1.3%.
Top 3 headwinds
China slowdown weighs
The event affects Emerging Markets Equities through growth activity and the listed supplied exposures.
Event: China reported 4.7% first-half GDP growth and 4.3% second-quarter growth. Industrial output rose 5.4%, high-tech manufacturing 13.3%, and exports 13.4%, but fixed-asset investment fell 5.7%, real-estate investment fell 18.0%, and retail sales rose only 1.3%.
Import costs rise
The event affects Emerging Markets Equities through geopolitics trade and the listed supplied exposures.
Event: Reports described intensified attacks, reduced vessel transit, and renewed concern about shipping and energy supply through the Strait of Hormuz. Oil remained near a monthly high despite a lower settlement on July 16.
Fed restraint remains
The event affects Emerging Markets Equities through monetary policy liquidity and the listed supplied exposures.
Event: Minutes of the June meeting described elevated inflation, higher energy and input costs, and tariff effects, while staff expected inflation to slow later but remain sticky in core components.
Single-day detail Technical breadth, fresh-event pulse, and largest symbol moves 7
The single-day was bearish with 0 advancing, 7 declining, and 0 unchanged symbols. Daily conditions are diverging from the medium-term opportunity score of 0.4. Risk was normal and the risk-adjusted daily setup was cautious.
Inside the window from the July 15 close through the July 16 cutoff, fresh verified events produced a mixed directional balance and high event risk. The largest immediate driver was tsmc outlook strongly supports taiwan technology exposure.
Price and breadth were bearish, while fresh-event direction was mixed with high event risk. The combined single-day setup is cautious with elevated risk. The single-day picture diverges from the balanced medium-term regime.
Fresh-event pressure leaders
Largest normalized symbol moves
Full tailwind ledger Evidence, counterpoints, pressure, and sources 5
TSMC supports Taiwan tech
The event affects Emerging Markets Equities through business asset fundamentals and the listed supplied exposures.
Event: TSMC reported a 77% year-over-year profit increase, raised its revenue-growth outlook to more than 40%, and set 2026 capital spending at $60 billion to $64 billion.
How calculated
+22.1 = event impact +1.7 x factor weight 13% x 100. Exposure relevance = 50% symbol coverage + 30% directness + 20% transmission.
U.S. rate pressure eased
The event affects Emerging Markets Equities through monetary policy liquidity and the listed supplied exposures.
Event: The U.S. CPI fell 0.4% in June, while core CPI was unchanged; annual headline inflation slowed to 3.5% and core inflation to 2.6%.
How calculated
+19.4 = event impact +1.9 x factor weight 10% x 100. Exposure relevance = 50% symbol coverage + 30% directness + 20% transmission.
High-tech output supports Asia
The event affects Emerging Markets Equities through business asset fundamentals and the listed supplied exposures.
Event: China reported 4.7% first-half GDP growth and 4.3% second-quarter growth. Industrial output rose 5.4%, high-tech manufacturing 13.3%, and exports 13.4%, but fixed-asset investment fell 5.7%, real-estate investment fell 18.0%, and retail sales rose only 1.3%.
How calculated
+6.4 = event impact +0.5 x factor weight 13% x 100. Exposure relevance = 50% symbol coverage + 30% directness + 20% transmission.
Energy exporters gain
The event affects Emerging Markets Equities through supply demand and the listed supplied exposures.
Event: Reports described intensified attacks, reduced vessel transit, and renewed concern about shipping and energy supply through the Strait of Hormuz. Oil remained near a monthly high despite a lower settlement on July 16.
How calculated
+2.4 = event impact +0.5 x factor weight 5% x 100. Exposure relevance = 50% symbol coverage + 30% directness + 20% transmission.
4 of 7 symbols remain in medium-term uptrends.
4 of 7 symbols remain in medium-term uptrends.
Full headwind ledger Evidence, counterpoints, pressure, and sources 5
China slowdown weighs
The event affects Emerging Markets Equities through growth activity and the listed supplied exposures.
Event: China reported 4.7% first-half GDP growth and 4.3% second-quarter growth. Industrial output rose 5.4%, high-tech manufacturing 13.3%, and exports 13.4%, but fixed-asset investment fell 5.7%, real-estate investment fell 18.0%, and retail sales rose only 1.3%.
How calculated
-16 = event impact -1.1 x factor weight 14% x 100. Exposure relevance = 50% symbol coverage + 30% directness + 20% transmission.
Import costs rise
The event affects Emerging Markets Equities through geopolitics trade and the listed supplied exposures.
Event: Reports described intensified attacks, reduced vessel transit, and renewed concern about shipping and energy supply through the Strait of Hormuz. Oil remained near a monthly high despite a lower settlement on July 16.
How calculated
-8.5 = event impact -1.2 x factor weight 7% x 100. Exposure relevance = 50% symbol coverage + 30% directness + 20% transmission.
Fed restraint remains
The event affects Emerging Markets Equities through monetary policy liquidity and the listed supplied exposures.
Event: Minutes of the June meeting described elevated inflation, higher energy and input costs, and tariff effects, while staff expected inflation to slow later but remain sticky in core components.
How calculated
-7.6 = event impact -0.8 x factor weight 10% x 100. Exposure relevance = 50% symbol coverage + 30% directness + 20% transmission.
ECB risk adds funding pressure
The event affects Emerging Markets Equities through monetary policy liquidity and the listed supplied exposures.
Event: A Reuters economist poll expected the ECB to hold its policy rate at 2.25% on July 23, while renewed energy-price pressure maintained the possibility of a September increase.
How calculated
-6.1 = event impact -0.6 x factor weight 10% x 100. Exposure relevance = 50% symbol coverage + 30% directness + 20% transmission.
2 of 7 symbols remain in medium-term downtrends.
2 of 7 symbols remain in medium-term downtrends.
Market-force scorecard Ranked News & Events transmission channels 8
Pressure methodology
Pressure is a signed evidence-strength measure, not a probability or forecast. Event impact = direction x event strength x exposure relevance x mechanism share. Weighted pressure = event impact x factor importance x 100. Expand "How calculated" beside any force for its exact components.
| Force | Direction | Factor | Pressure |
|---|---|---|---|
| TSMC supports Taiwan tech 18 The event affects Emerging Markets Equities through business asset fundamentals and the listed supplied exposures. | Tailwind | Business Asset Fundamentals |
+22.1
How calculated
Event strength
2.227
Symbol coverage
60%
Directness
95%
Transmission
90%
Exposure relevance
0.765
Mechanism share
100%
Event impact
+1.7
Factor weight
13%
+22.1 = event impact +1.7 x factor weight 13% x 100. Exposure relevance = 50% symbol coverage + 30% directness + 20% transmission. |
| U.S. rate pressure eased 1 The event affects Emerging Markets Equities through monetary policy liquidity and the listed supplied exposures. | Tailwind | Monetary Policy Liquidity |
+19.4
How calculated
Event strength
2.125
Symbol coverage
100%
Directness
85%
Transmission
80%
Exposure relevance
0.915
Mechanism share
100%
Event impact
+1.9
Factor weight
10%
+19.4 = event impact +1.9 x factor weight 10% x 100. Exposure relevance = 50% symbol coverage + 30% directness + 20% transmission. |
| China slowdown weighs 8 The event affects Emerging Markets Equities through growth activity and the listed supplied exposures. | Headwind | Growth Activity |
-16
How calculated
Event strength
2.300
Symbol coverage
75%
Directness
80%
Transmission
75%
Exposure relevance
0.765
Mechanism share
65%
Event impact
-1.1
Factor weight
14%
-16 = event impact -1.1 x factor weight 14% x 100. Exposure relevance = 50% symbol coverage + 30% directness + 20% transmission. |
| Import costs rise 1314 The event affects Emerging Markets Equities through geopolitics trade and the listed supplied exposures. | Headwind | Geopolitics Trade |
-8.5
How calculated
Event strength
2.325
Symbol coverage
80%
Directness
85%
Transmission
75%
Exposure relevance
0.805
Mechanism share
65%
Event impact
-1.2
Factor weight
7%
-8.5 = event impact -1.2 x factor weight 7% x 100. Exposure relevance = 50% symbol coverage + 30% directness + 20% transmission. |
| Fed restraint remains 7 The event affects Emerging Markets Equities through monetary policy liquidity and the listed supplied exposures. | Headwind | Monetary Policy Liquidity |
-7.6
How calculated
Event strength
0.835
Symbol coverage
100%
Directness
85%
Transmission
80%
Exposure relevance
0.915
Mechanism share
100%
Event impact
-0.8
Factor weight
10%
-7.6 = event impact -0.8 x factor weight 10% x 100. Exposure relevance = 50% symbol coverage + 30% directness + 20% transmission. |
| High-tech output supports Asia 8 The event affects Emerging Markets Equities through business asset fundamentals and the listed supplied exposures. | Tailwind | Business Asset Fundamentals |
+6.4
How calculated
Event strength
2.300
Symbol coverage
55%
Directness
70%
Transmission
65%
Exposure relevance
0.615
Mechanism share
35%
Event impact
+0.5
Factor weight
13%
+6.4 = event impact +0.5 x factor weight 13% x 100. Exposure relevance = 50% symbol coverage + 30% directness + 20% transmission. |
| ECB risk adds funding pressure 11 The event affects Emerging Markets Equities through monetary policy liquidity and the listed supplied exposures. | Headwind | Monetary Policy Liquidity |
-6.1
How calculated
Event strength
0.847
Symbol coverage
100%
Directness
45%
Transmission
40%
Exposure relevance
0.715
Mechanism share
100%
Event impact
-0.6
Factor weight
10%
-6.1 = event impact -0.6 x factor weight 10% x 100. Exposure relevance = 50% symbol coverage + 30% directness + 20% transmission. |
| Energy exporters gain 1314 The event affects Emerging Markets Equities through supply demand and the listed supplied exposures. | Tailwind | Supply Demand |
+2.4
How calculated
Event strength
2.325
Symbol coverage
55%
Directness
65%
Transmission
55%
Exposure relevance
0.580
Mechanism share
35%
Event impact
+0.5
Factor weight
5%
+2.4 = event impact +0.5 x factor weight 5% x 100. Exposure relevance = 50% symbol coverage + 30% directness + 20% transmission. |
Symbol intelligence Trend, volatility, stretch, and mapped evidence 7
Emerging Markets Broad Index
Emerging Markets Broad Index remains in an uptrend with normal volatility. It is near trend relative to trend. Price is 1.0% below the 50-day average and 4.8% above the 200-day average. The strongest mapped News & Events force is tsmc outlook strongly supports taiwan technology exposure.
Risk: Favorable uptrend setupEmerging Markets Ex-China
Emerging Markets Ex-China remains in an uptrend with elevated volatility. It is oversold relative to trend. Price is 5.3% below the 50-day average and 13.6% above the 200-day average. The strongest mapped News & Events force is tsmc outlook strongly supports taiwan technology exposure.
Risk: Uptrend with mixed riskTaiwan Index
Taiwan Index remains in an uptrend with elevated volatility. It is near trend relative to trend. Price is 1.1% below the 50-day average and 30.8% above the 200-day average. The strongest mapped News & Events force is tsmc outlook strongly supports taiwan technology exposure.
Risk: Uptrend with mixed riskSouth Korea Index
South Korea Index is moving sideways with high volatility. It is very oversold relative to trend. Price is 14.5% below the 50-day average and 23.5% above the 200-day average. The strongest mapped News & Events force is u.s. disinflation eases global rate pressure.
Risk: Choppy range, short-term trading onlyBrazil Index
Brazil Index remains in an uptrend with normal volatility. It is near trend relative to trend. Price is 0.3% below the 50-day average and 2.4% above the 200-day average. The strongest mapped News & Events force is u.s. disinflation eases global rate pressure.
Risk: Favorable uptrend setupSouth Africa Index
South Africa Index remains in a downtrend with elevated volatility. It is near trend relative to trend. Price is 4.1% below the 50-day average and 5.3% below the 200-day average. The strongest mapped News & Events force is u.s. disinflation eases global rate pressure.
Risk: High downside riskIndia Index
India Index remains in a downtrend with normal volatility. It is near trend relative to trend. Price is 0.0% above the 50-day average and 4.9% below the 200-day average. The strongest mapped News & Events force is u.s. disinflation eases global rate pressure.
Risk: Persistent downtrend6 Energy Technical and news evidence remain broadly balanced Sideways +0.2 Balanced
The medium-term technical regime is sideways with elevated volatility and a technical score of 0.1. Verified News & Events evidence is neutral overall, led by hormuz disruption tightens perceived energy supply. Both technical and News & Events evidence remain broadly balanced. Consolidation confidence is moderate.
Top 3 tailwinds
Hormuz tightens supply
The event affects Energy through supply demand and the listed supplied exposures.
Event: Reports described intensified attacks, reduced vessel transit, and renewed concern about shipping and energy supply through the Strait of Hormuz. Oil remained near a monthly high despite a lower settlement on July 16.
U.S. demand stayed resilient
The event affects Energy through growth activity and the listed supplied exposures.
Event: Advance retail and food-service sales were $768.6 billion, up 0.2% from May and 6.7% from a year earlier; May was revised to a 1.0% monthly increase.
Factory demand improved
The event affects Energy through growth activity and the listed supplied exposures.
Event: The Philadelphia Fed reported increases in general activity, new orders, shipments, and employment, while price indexes remained elevated.
Top 3 headwinds
China demand softened
The event affects Energy through growth activity and the listed supplied exposures.
Event: China reported 4.7% first-half GDP growth and 4.3% second-quarter growth. Industrial output rose 5.4%, high-tech manufacturing 13.3%, and exports 13.4%, but fixed-asset investment fell 5.7%, real-estate investment fell 18.0%, and retail sales rose only 1.3%.
Shipping risk increased
The event affects Energy through geopolitics trade and the listed supplied exposures.
Event: Reports described intensified attacks, reduced vessel transit, and renewed concern about shipping and energy supply through the Strait of Hormuz. Oil remained near a monthly high despite a lower settlement on July 16.
1 of 5 symbols remain in medium-term downtrends.
1 of 5 symbols remain in medium-term downtrends.
Single-day detail Technical breadth, fresh-event pulse, and largest symbol moves 5
The single-day was mixed with 2 advancing, 3 declining, and 0 unchanged symbols. Daily conditions are neutral with the medium-term regime. Risk was normal and the risk-adjusted daily setup was balanced.
Inside the window from the July 15 close through the July 16 cutoff, fresh verified events produced a strong bullish directional balance and high event risk. The largest immediate driver was hormuz disruption tightens perceived energy supply.
Price and breadth were mixed, while fresh-event direction was strong bullish with high event risk. The combined single-day setup is favorable with elevated risk. The single-day picture diverges from the balanced medium-term regime.
Fresh-event pressure leaders
Largest normalized symbol moves
Full tailwind ledger Evidence, counterpoints, pressure, and sources 4
Hormuz tightens supply
The event affects Energy through supply demand and the listed supplied exposures.
Event: Reports described intensified attacks, reduced vessel transit, and renewed concern about shipping and energy supply through the Strait of Hormuz. Oil remained near a monthly high despite a lower settlement on July 16.
How calculated
+30.1 = event impact +1.6 x factor weight 19% x 100. Exposure relevance = 50% symbol coverage + 30% directness + 20% transmission.
U.S. demand stayed resilient
The event affects Energy through growth activity and the listed supplied exposures.
Event: Advance retail and food-service sales were $768.6 billion, up 0.2% from May and 6.7% from a year earlier; May was revised to a 1.0% monthly increase.
How calculated
+4.1 = event impact +0.3 x factor weight 12% x 100. Exposure relevance = 50% symbol coverage + 30% directness + 20% transmission.
Factory demand improved
The event affects Energy through growth activity and the listed supplied exposures.
Event: The Philadelphia Fed reported increases in general activity, new orders, shipments, and employment, while price indexes remained elevated.
How calculated
+4.1 = event impact +0.3 x factor weight 12% x 100. Exposure relevance = 50% symbol coverage + 30% directness + 20% transmission.
2 of 5 symbols remain in medium-term uptrends.
2 of 5 symbols remain in medium-term uptrends.
Full headwind ledger Evidence, counterpoints, pressure, and sources 3
China demand softened
The event affects Energy through growth activity and the listed supplied exposures.
Event: China reported 4.7% first-half GDP growth and 4.3% second-quarter growth. Industrial output rose 5.4%, high-tech manufacturing 13.3%, and exports 13.4%, but fixed-asset investment fell 5.7%, real-estate investment fell 18.0%, and retail sales rose only 1.3%.
How calculated
-23.9 = event impact -2 x factor weight 12% x 100. Exposure relevance = 50% symbol coverage + 30% directness + 20% transmission.
Shipping risk increased
The event affects Energy through geopolitics trade and the listed supplied exposures.
Event: Reports described intensified attacks, reduced vessel transit, and renewed concern about shipping and energy supply through the Strait of Hormuz. Oil remained near a monthly high despite a lower settlement on July 16.
How calculated
-6.5 = event impact -0.5 x factor weight 13% x 100. Exposure relevance = 50% symbol coverage + 30% directness + 20% transmission.
1 of 5 symbols remain in medium-term downtrends.
1 of 5 symbols remain in medium-term downtrends.
Market-force scorecard Ranked News & Events transmission channels 5
Pressure methodology
Pressure is a signed evidence-strength measure, not a probability or forecast. Event impact = direction x event strength x exposure relevance x mechanism share. Weighted pressure = event impact x factor importance x 100. Expand "How calculated" beside any force for its exact components.
| Force | Direction | Factor | Pressure |
|---|---|---|---|
| Hormuz tightens supply 1314 The event affects Energy through supply demand and the listed supplied exposures. | Tailwind | Supply Demand |
+30.1
How calculated
Event strength
2.325
Symbol coverage
85%
Directness
98%
Transmission
95%
Exposure relevance
0.909
Mechanism share
75%
Event impact
+1.6
Factor weight
19%
+30.1 = event impact +1.6 x factor weight 19% x 100. Exposure relevance = 50% symbol coverage + 30% directness + 20% transmission. |
| China demand softened 8 The event affects Energy through growth activity and the listed supplied exposures. | Headwind | Growth Activity |
-23.9
How calculated
Event strength
2.300
Symbol coverage
100%
Directness
75%
Transmission
70%
Exposure relevance
0.865
Mechanism share
100%
Event impact
-2
Factor weight
12%
-23.9 = event impact -2 x factor weight 12% x 100. Exposure relevance = 50% symbol coverage + 30% directness + 20% transmission. |
| Shipping risk increased 1314 The event affects Energy through geopolitics trade and the listed supplied exposures. | Headwind | Geopolitics Trade |
-6.5
How calculated
Event strength
2.325
Symbol coverage
85%
Directness
90%
Transmission
80%
Exposure relevance
0.855
Mechanism share
25%
Event impact
-0.5
Factor weight
13%
-6.5 = event impact -0.5 x factor weight 13% x 100. Exposure relevance = 50% symbol coverage + 30% directness + 20% transmission. |
| U.S. demand stayed resilient 3 The event affects Energy through growth activity and the listed supplied exposures. | Tailwind | Growth Activity |
+4.1
How calculated
Event strength
0.501
Symbol coverage
85%
Directness
55%
Transmission
45%
Exposure relevance
0.680
Mechanism share
100%
Event impact
+0.3
Factor weight
12%
+4.1 = event impact +0.3 x factor weight 12% x 100. Exposure relevance = 50% symbol coverage + 30% directness + 20% transmission. |
| Factory demand improved 5 The event affects Energy through growth activity and the listed supplied exposures. | Tailwind | Growth Activity |
+4.1
How calculated
Event strength
0.455
Symbol coverage
100%
Directness
55%
Transmission
45%
Exposure relevance
0.755
Mechanism share
100%
Event impact
+0.3
Factor weight
12%
+4.1 = event impact +0.3 x factor weight 12% x 100. Exposure relevance = 50% symbol coverage + 30% directness + 20% transmission. |
Symbol intelligence Trend, volatility, stretch, and mapped evidence 5
US Crude Oil
US Crude Oil is moving sideways with elevated volatility. It is oversold relative to trend. Price is 5.5% below the 50-day average and 22.9% above the 200-day average. The strongest mapped News & Events force is hormuz disruption tightens perceived energy supply.
Risk: Choppy range, short-term trading onlyBrent Crude Oil
Brent Crude Oil is moving sideways with high volatility. It is near trend relative to trend. Price is 4.4% below the 50-day average and 19.8% above the 200-day average. The strongest mapped News & Events force is hormuz disruption tightens perceived energy supply.
Risk: Choppy range, short-term trading onlyUS Energy Sector
US Energy Sector remains in an uptrend with normal volatility. It is near trend relative to trend. Price is 1.3% above the 50-day average and 11.4% above the 200-day average. The strongest mapped News & Events force is hormuz disruption tightens perceived energy supply.
Risk: Favorable uptrend setupOil and Gas Producers
Oil and Gas Producers remains in an uptrend with elevated volatility. It is near trend relative to trend. Price is 1.8% above the 50-day average and 12.4% above the 200-day average. The strongest mapped News & Events force is hormuz disruption tightens perceived energy supply.
Risk: Uptrend with mixed riskNatural Gas
Natural Gas remains in a downtrend with high volatility. It is oversold relative to trend. Price is 8.0% below the 50-day average and 15.1% below the 200-day average. The strongest mapped News & Events force is china growth and property weakness temper demand.
Risk: High downside risk7 Fixed Income Balanced technical view with incomplete news validation Sideways +0.1 Balanced
The medium-term technical regime is sideways with low volatility and a technical score of 0.1. The News & Events score is excluded because the branch did not pass reference validation. Cross-branch alignment is unavailable because one branch did not pass publication validation. Consolidation confidence is moderate.
Top 3 tailwinds
CPI supports duration
The event affects Fixed Income through inflation rates and the listed supplied exposures.
Event: The U.S. CPI fell 0.4% in June, while core CPI was unchanged; annual headline inflation slowed to 3.5% and core inflation to 2.6%.
PPI supports bonds
The event affects Fixed Income through inflation rates and the listed supplied exposures.
Event: Final-demand PPI fell 0.3% in June and goods prices fell 1.4%, but the measure excluding food, energy, and trade services rose 0.1% and remained 5.1% above a year earlier.
Safe-haven demand rose
The event affects Fixed Income through geopolitics trade and the listed supplied exposures.
Event: Reports described intensified attacks, reduced vessel transit, and renewed concern about shipping and energy supply through the Strait of Hormuz. Oil remained near a monthly high despite a lower settlement on July 16.
Top 3 headwinds
Energy risk pressures bonds
The event affects Fixed Income through inflation rates and the listed supplied exposures.
Event: Reports described intensified attacks, reduced vessel transit, and renewed concern about shipping and energy supply through the Strait of Hormuz. Oil remained near a monthly high despite a lower settlement on July 16.
Fed restraint persists
The event affects Fixed Income through monetary policy liquidity and the listed supplied exposures.
Event: Minutes of the June meeting described elevated inflation, higher energy and input costs, and tariff effects, while staff expected inflation to slow later but remain sticky in core components.
ECB hike risk rose
The event affects Fixed Income through monetary policy liquidity and the listed supplied exposures.
Event: A Reuters economist poll expected the ECB to hold its policy rate at 2.25% on July 23, while renewed energy-price pressure maintained the possibility of a September increase.
Single-day detail Technical breadth, fresh-event pulse, and largest symbol moves 7
The single-day was bearish with 0 advancing, 3 declining, and 4 unchanged symbols. Daily conditions are diverging from the medium-term opportunity score of 0.1. Risk was low and the risk-adjusted daily setup was cautious.
Inside the window from the July 15 close through the July 16 cutoff, fresh verified events produced a strong bearish directional balance and high event risk. The largest immediate driver was energy disruption raises inflation risk.
Price and breadth were bearish, while fresh-event scoring was excluded by publication validation. The combined single-day setup is cautious with low risk. The single-day picture diverges from the balanced medium-term regime. This single-day view is partial because only one branch passed usability checks.
Fresh-event pressure leaders
Largest normalized symbol moves
Full tailwind ledger Evidence, counterpoints, pressure, and sources 5
CPI supports duration
The event affects Fixed Income through inflation rates and the listed supplied exposures.
Event: The U.S. CPI fell 0.4% in June, while core CPI was unchanged; annual headline inflation slowed to 3.5% and core inflation to 2.6%.
How calculated
+34.9 = event impact +2.1 x factor weight 17% x 100. Exposure relevance = 50% symbol coverage + 30% directness + 20% transmission.
PPI supports bonds
The event affects Fixed Income through inflation rates and the listed supplied exposures.
Event: Final-demand PPI fell 0.3% in June and goods prices fell 1.4%, but the measure excluding food, energy, and trade services rose 0.1% and remained 5.1% above a year earlier.
How calculated
+9.7 = event impact +0.6 x factor weight 17% x 100. Exposure relevance = 50% symbol coverage + 30% directness + 20% transmission.
Safe-haven demand rose
The event affects Fixed Income through geopolitics trade and the listed supplied exposures.
Event: Reports described intensified attacks, reduced vessel transit, and renewed concern about shipping and energy supply through the Strait of Hormuz. Oil remained near a monthly high despite a lower settlement on July 16.
How calculated
+1.7 = event impact +0.6 x factor weight 3% x 100. Exposure relevance = 50% symbol coverage + 30% directness + 20% transmission.
Low volatility supports a more orderly technical environment.
Low volatility supports a more orderly technical environment.
Some components remain near their intermediate trend rather than deeply stretched.
Some components remain near their intermediate trend rather than deeply stretched.
Full headwind ledger Evidence, counterpoints, pressure, and sources 9
Energy risk pressures bonds
The event affects Fixed Income through inflation rates and the listed supplied exposures.
Event: Reports described intensified attacks, reduced vessel transit, and renewed concern about shipping and energy supply through the Strait of Hormuz. Oil remained near a monthly high despite a lower settlement on July 16.
How calculated
-21.1 = event impact -1.2 x factor weight 17% x 100. Exposure relevance = 50% symbol coverage + 30% directness + 20% transmission.
Fed restraint persists
The event affects Fixed Income through monetary policy liquidity and the listed supplied exposures.
Event: Minutes of the June meeting described elevated inflation, higher energy and input costs, and tariff effects, while staff expected inflation to slow later but remain sticky in core components.
How calculated
-14.1 = event impact -0.7 x factor weight 19% x 100. Exposure relevance = 50% symbol coverage + 30% directness + 20% transmission.
ECB hike risk rose
The event affects Fixed Income through monetary policy liquidity and the listed supplied exposures.
Event: A Reuters economist poll expected the ECB to hold its policy rate at 2.25% on July 23, while renewed energy-price pressure maintained the possibility of a September increase.
How calculated
-9.3 = event impact -0.5 x factor weight 19% x 100. Exposure relevance = 50% symbol coverage + 30% directness + 20% transmission.
Core PPI stays firm
The event affects Fixed Income through inflation rates and the listed supplied exposures.
Event: Final-demand PPI fell 0.3% in June and goods prices fell 1.4%, but the measure excluding food, energy, and trade services rose 0.1% and remained 5.1% above a year earlier.
How calculated
-8.7 = event impact -0.5 x factor weight 17% x 100. Exposure relevance = 50% symbol coverage + 30% directness + 20% transmission.
Retail demand supports yields
The event affects Fixed Income through growth activity and the listed supplied exposures.
Event: Advance retail and food-service sales were $768.6 billion, up 0.2% from May and 6.7% from a year earlier; May was revised to a 1.0% monthly increase.
How calculated
-4.3 = event impact -0.3 x factor weight 13% x 100. Exposure relevance = 50% symbol coverage + 30% directness + 20% transmission.
Factory data pressures duration
The event affects Fixed Income through growth activity and the listed supplied exposures.
Event: The Philadelphia Fed reported increases in general activity, new orders, shipments, and employment, while price indexes remained elevated.
How calculated
-3.3 = event impact -0.3 x factor weight 13% x 100. Exposure relevance = 50% symbol coverage + 30% directness + 20% transmission.
Low claims limit easing
The event affects Fixed Income through employment consumer and the listed supplied exposures.
Event: Initial claims fell to 208,000 from a revised 216,000, while the four-week average was 214,250 and continuing claims were 1.805 million.
How calculated
-1.9 = event impact -0.3 x factor weight 7% x 100. Exposure relevance = 50% symbol coverage + 30% directness + 20% transmission.
Average price is 0.2% below the 50-day trend.
Average price is 0.2% below the 50-day trend.
The single-day produced a bearish breadth-and-move score.
The single-day produced a bearish breadth-and-move score.
Market-force scorecard Ranked News & Events transmission channels 10
Pressure methodology
Pressure is a signed evidence-strength measure, not a probability or forecast. Event impact = direction x event strength x exposure relevance x mechanism share. Weighted pressure = event impact x factor importance x 100. Expand "How calculated" beside any force for its exact components.
| Force | Direction | Factor | Pressure |
|---|---|---|---|
| CPI supports duration 1 The event affects Fixed Income through inflation rates and the listed supplied exposures. | Tailwind | Inflation Rates |
+34.9
How calculated
Event strength
2.125
Symbol coverage
100%
Directness
95%
Transmission
90%
Exposure relevance
0.965
Mechanism share
100%
Event impact
+2.1
Factor weight
17%
+34.9 = event impact +2.1 x factor weight 17% x 100. Exposure relevance = 50% symbol coverage + 30% directness + 20% transmission. |
| Energy risk pressures bonds 1314 The event affects Fixed Income through inflation rates and the listed supplied exposures. | Headwind | Inflation Rates |
-21.1
How calculated
Event strength
2.325
Symbol coverage
90%
Directness
90%
Transmission
85%
Exposure relevance
0.890
Mechanism share
60%
Event impact
-1.2
Factor weight
17%
-21.1 = event impact -1.2 x factor weight 17% x 100. Exposure relevance = 50% symbol coverage + 30% directness + 20% transmission. |
| Fed restraint persists 7 The event affects Fixed Income through monetary policy liquidity and the listed supplied exposures. | Headwind | Monetary Policy Liquidity |
-14.1
How calculated
Event strength
0.835
Symbol coverage
85%
Directness
95%
Transmission
90%
Exposure relevance
0.890
Mechanism share
100%
Event impact
-0.7
Factor weight
19%
-14.1 = event impact -0.7 x factor weight 19% x 100. Exposure relevance = 50% symbol coverage + 30% directness + 20% transmission. |
| PPI supports bonds 2 The event affects Fixed Income through inflation rates and the listed supplied exposures. | Tailwind | Inflation Rates |
+9.7
How calculated
Event strength
1.333
Symbol coverage
75%
Directness
85%
Transmission
75%
Exposure relevance
0.780
Mechanism share
55%
Event impact
+0.6
Factor weight
17%
+9.7 = event impact +0.6 x factor weight 17% x 100. Exposure relevance = 50% symbol coverage + 30% directness + 20% transmission. |
| ECB hike risk rose 11 The event affects Fixed Income through monetary policy liquidity and the listed supplied exposures. | Headwind | Monetary Policy Liquidity |
-9.3
How calculated
Event strength
0.847
Symbol coverage
65%
Directness
55%
Transmission
45%
Exposure relevance
0.580
Mechanism share
100%
Event impact
-0.5
Factor weight
19%
-9.3 = event impact -0.5 x factor weight 19% x 100. Exposure relevance = 50% symbol coverage + 30% directness + 20% transmission. |
| Core PPI stays firm 2 The event affects Fixed Income through inflation rates and the listed supplied exposures. | Headwind | Inflation Rates |
-8.7
How calculated
Event strength
1.333
Symbol coverage
90%
Directness
85%
Transmission
75%
Exposure relevance
0.855
Mechanism share
45%
Event impact
-0.5
Factor weight
17%
-8.7 = event impact -0.5 x factor weight 17% x 100. Exposure relevance = 50% symbol coverage + 30% directness + 20% transmission. |
| Retail demand supports yields 3 The event affects Fixed Income through growth activity and the listed supplied exposures. | Headwind | Growth Activity |
-4.3
How calculated
Event strength
0.501
Symbol coverage
65%
Directness
70%
Transmission
60%
Exposure relevance
0.655
Mechanism share
100%
Event impact
-0.3
Factor weight
13%
-4.3 = event impact -0.3 x factor weight 13% x 100. Exposure relevance = 50% symbol coverage + 30% directness + 20% transmission. |
| Factory data pressures duration 5 The event affects Fixed Income through growth activity and the listed supplied exposures. | Headwind | Growth Activity |
-3.3
How calculated
Event strength
0.455
Symbol coverage
50%
Directness
65%
Transmission
55%
Exposure relevance
0.555
Mechanism share
100%
Event impact
-0.3
Factor weight
13%
-3.3 = event impact -0.3 x factor weight 13% x 100. Exposure relevance = 50% symbol coverage + 30% directness + 20% transmission. |
| Low claims limit easing 4 The event affects Fixed Income through employment consumer and the listed supplied exposures. | Headwind | Employment Consumer |
-1.9
How calculated
Event strength
0.411
Symbol coverage
60%
Directness
75%
Transmission
65%
Exposure relevance
0.655
Mechanism share
100%
Event impact
-0.3
Factor weight
7%
-1.9 = event impact -0.3 x factor weight 7% x 100. Exposure relevance = 50% symbol coverage + 30% directness + 20% transmission. |
| Safe-haven demand rose 1314 The event affects Fixed Income through geopolitics trade and the listed supplied exposures. | Tailwind | Geopolitics Trade |
+1.7
How calculated
Event strength
2.325
Symbol coverage
50%
Directness
75%
Transmission
60%
Exposure relevance
0.595
Mechanism share
40%
Event impact
+0.6
Factor weight
3%
+1.7 = event impact +0.6 x factor weight 3% x 100. Exposure relevance = 50% symbol coverage + 30% directness + 20% transmission. |
Symbol intelligence Trend, volatility, stretch, and mapped evidence 7
US Broad Bond Market
US Broad Bond Market is moving sideways with low volatility. It is near trend relative to trend. Price is 0.0% below the 50-day average and 0.0% above the 200-day average. The strongest mapped News & Events force is cooling cpi supports duration.
Risk: Sideways, wait-and-seeIntermediate US Treasuries
Intermediate US Treasuries is moving sideways with low volatility. It is near trend relative to trend. Price is 0.1% below the 50-day average and 0.6% below the 200-day average. The strongest mapped News & Events force is cooling cpi supports duration.
Risk: Sideways, wait-and-seeInvestment-Grade Corporate Bonds
Investment-Grade Corporate Bonds is moving sideways with low volatility. It is near trend relative to trend. Price is 0.5% below the 50-day average and 0.5% below the 200-day average. The strongest mapped News & Events force is cooling cpi supports duration.
Risk: Sideways, wait-and-seeInflation-Protected Treasuries
Inflation-Protected Treasuries is moving sideways with low volatility. It is near trend relative to trend. Price is 0.4% below the 50-day average and 0.1% above the 200-day average. The strongest mapped News & Events force is cooling cpi supports duration.
Risk: Sideways, wait-and-seeLong-Term US Treasuries
Long-Term US Treasuries is moving sideways with low volatility. It is near trend relative to trend. Price is 0.9% below the 50-day average and 2.1% below the 200-day average. The strongest mapped News & Events force is cooling cpi supports duration.
Risk: Sideways, wait-and-seeHigh-Yield Corporate Bonds
High-Yield Corporate Bonds is moving sideways with low volatility. It is near trend relative to trend. Price is 0.5% above the 50-day average and 1.7% above the 200-day average. The strongest mapped News & Events force is cooling cpi supports duration.
Risk: Sideways, wait-and-seeShort-Term US Treasuries
Short-Term US Treasuries is moving sideways with low volatility. It is near trend relative to trend. Price is 0.3% above the 50-day average and 0.7% above the 200-day average. The strongest mapped News & Events force is cooling cpi supports duration.
Risk: Sideways, wait-and-see8 Hong Kong Equities Technical and news evidence remain broadly balanced Sideways -0.1 Balanced
The medium-term technical regime is sideways with normal volatility and a technical score of -0.3. Verified News & Events evidence is neutral overall, led by mainland growth slowdown weighs on hong kong exposure. Both technical and News & Events evidence remain broadly balanced. Consolidation confidence is moderate-high.
Top 3 tailwinds
AI demand supports tech
The event affects Hong Kong Equities through business asset fundamentals and the listed supplied exposures.
Event: TSMC reported a 77% year-over-year profit increase, raised its revenue-growth outlook to more than 40%, and set 2026 capital spending at $60 billion to $64 billion.
Linked-rate pressure eased
The event affects Hong Kong Equities through monetary policy liquidity and the listed supplied exposures.
Event: The U.S. CPI fell 0.4% in June, while core CPI was unchanged; annual headline inflation slowed to 3.5% and core inflation to 2.6%.
High-tech output supports tech
The event affects Hong Kong Equities through business asset fundamentals and the listed supplied exposures.
Event: China reported 4.7% first-half GDP growth and 4.3% second-quarter growth. Industrial output rose 5.4%, high-tech manufacturing 13.3%, and exports 13.4%, but fixed-asset investment fell 5.7%, real-estate investment fell 18.0%, and retail sales rose only 1.3%.
Top 3 headwinds
Mainland growth slowed
The event affects Hong Kong Equities through growth activity and the listed supplied exposures.
Event: China reported 4.7% first-half GDP growth and 4.3% second-quarter growth. Industrial output rose 5.4%, high-tech manufacturing 13.3%, and exports 13.4%, but fixed-asset investment fell 5.7%, real-estate investment fell 18.0%, and retail sales rose only 1.3%.
Trade disruption adds risk
The event affects Hong Kong Equities through geopolitics trade and the listed supplied exposures.
Event: Reports described intensified attacks, reduced vessel transit, and renewed concern about shipping and energy supply through the Strait of Hormuz. Oil remained near a monthly high despite a lower settlement on July 16.
3 of 4 symbols remain in medium-term downtrends.
3 of 4 symbols remain in medium-term downtrends.
Single-day detail Technical breadth, fresh-event pulse, and largest symbol moves 1
Single-day coverage is unavailable because only 1 of 4 expected symbols have usable same-session return and ATR data.
Inside the window from the July 15 close through the July 16 cutoff, fresh verified events produced a bullish directional balance and elevated event risk. The largest immediate driver was ai demand supports technology-sector expectations.
Price and breadth coverage was unavailable, while fresh-event direction was bullish with elevated event risk. The combined single-day setup is favorable with elevated risk. The single-day picture diverges from the balanced medium-term regime. This single-day view is partial because only one branch passed usability checks.
Fresh-event pressure leaders
Largest normalized symbol moves
Full tailwind ledger Evidence, counterpoints, pressure, and sources 4
AI demand supports tech
The event affects Hong Kong Equities through business asset fundamentals and the listed supplied exposures.
Event: TSMC reported a 77% year-over-year profit increase, raised its revenue-growth outlook to more than 40%, and set 2026 capital spending at $60 billion to $64 billion.
How calculated
+20 = event impact +1.5 x factor weight 13% x 100. Exposure relevance = 50% symbol coverage + 30% directness + 20% transmission.
Linked-rate pressure eased
The event affects Hong Kong Equities through monetary policy liquidity and the listed supplied exposures.
Event: The U.S. CPI fell 0.4% in June, while core CPI was unchanged; annual headline inflation slowed to 3.5% and core inflation to 2.6%.
How calculated
+17.6 = event impact +1.8 x factor weight 10% x 100. Exposure relevance = 50% symbol coverage + 30% directness + 20% transmission.
High-tech output supports tech
The event affects Hong Kong Equities through business asset fundamentals and the listed supplied exposures.
Event: China reported 4.7% first-half GDP growth and 4.3% second-quarter growth. Industrial output rose 5.4%, high-tech manufacturing 13.3%, and exports 13.4%, but fixed-asset investment fell 5.7%, real-estate investment fell 18.0%, and retail sales rose only 1.3%.
How calculated
+9.6 = event impact +0.7 x factor weight 13% x 100. Exposure relevance = 50% symbol coverage + 30% directness + 20% transmission.
Normal volatility supports a more orderly technical environment.
Normal volatility supports a more orderly technical environment.
Full headwind ledger Evidence, counterpoints, pressure, and sources 3
Mainland growth slowed
The event affects Hong Kong Equities through growth activity and the listed supplied exposures.
Event: China reported 4.7% first-half GDP growth and 4.3% second-quarter growth. Industrial output rose 5.4%, high-tech manufacturing 13.3%, and exports 13.4%, but fixed-asset investment fell 5.7%, real-estate investment fell 18.0%, and retail sales rose only 1.3%.
How calculated
-21.3 = event impact -1.3 x factor weight 16% x 100. Exposure relevance = 50% symbol coverage + 30% directness + 20% transmission.
Trade disruption adds risk
The event affects Hong Kong Equities through geopolitics trade and the listed supplied exposures.
Event: Reports described intensified attacks, reduced vessel transit, and renewed concern about shipping and energy supply through the Strait of Hormuz. Oil remained near a monthly high despite a lower settlement on July 16.
How calculated
-11.6 = event impact -1.9 x factor weight 6% x 100. Exposure relevance = 50% symbol coverage + 30% directness + 20% transmission.
3 of 4 symbols remain in medium-term downtrends.
3 of 4 symbols remain in medium-term downtrends.
Market-force scorecard Ranked News & Events transmission channels 5
Pressure methodology
Pressure is a signed evidence-strength measure, not a probability or forecast. Event impact = direction x event strength x exposure relevance x mechanism share. Weighted pressure = event impact x factor importance x 100. Expand "How calculated" beside any force for its exact components.
| Force | Direction | Factor | Pressure |
|---|---|---|---|
| Mainland growth slowed 8 The event affects Hong Kong Equities through growth activity and the listed supplied exposures. | Headwind | Growth Activity |
-21.3
How calculated
Event strength
2.300
Symbol coverage
100%
Directness
95%
Transmission
90%
Exposure relevance
0.965
Mechanism share
60%
Event impact
-1.3
Factor weight
16%
-21.3 = event impact -1.3 x factor weight 16% x 100. Exposure relevance = 50% symbol coverage + 30% directness + 20% transmission. |
| AI demand supports tech 18 The event affects Hong Kong Equities through business asset fundamentals and the listed supplied exposures. | Tailwind | Business Asset Fundamentals |
+20
How calculated
Event strength
2.227
Symbol coverage
85%
Directness
55%
Transmission
50%
Exposure relevance
0.690
Mechanism share
100%
Event impact
+1.5
Factor weight
13%
+20 = event impact +1.5 x factor weight 13% x 100. Exposure relevance = 50% symbol coverage + 30% directness + 20% transmission. |
| Linked-rate pressure eased 1 The event affects Hong Kong Equities through monetary policy liquidity and the listed supplied exposures. | Tailwind | Monetary Policy Liquidity |
+17.6
How calculated
Event strength
2.125
Symbol coverage
100%
Directness
70%
Transmission
60%
Exposure relevance
0.830
Mechanism share
100%
Event impact
+1.8
Factor weight
10%
+17.6 = event impact +1.8 x factor weight 10% x 100. Exposure relevance = 50% symbol coverage + 30% directness + 20% transmission. |
| Trade disruption adds risk 1314 The event affects Hong Kong Equities through geopolitics trade and the listed supplied exposures. | Headwind | Geopolitics Trade |
-11.6
How calculated
Event strength
2.325
Symbol coverage
100%
Directness
70%
Transmission
60%
Exposure relevance
0.830
Mechanism share
100%
Event impact
-1.9
Factor weight
6%
-11.6 = event impact -1.9 x factor weight 6% x 100. Exposure relevance = 50% symbol coverage + 30% directness + 20% transmission. |
| High-tech output supports tech 8 The event affects Hong Kong Equities through business asset fundamentals and the listed supplied exposures. | Tailwind | Business Asset Fundamentals |
+9.6
How calculated
Event strength
2.300
Symbol coverage
85%
Directness
80%
Transmission
70%
Exposure relevance
0.805
Mechanism share
40%
Event impact
+0.7
Factor weight
13%
+9.6 = event impact +0.7 x factor weight 13% x 100. Exposure relevance = 50% symbol coverage + 30% directness + 20% transmission. |
Symbol intelligence Trend, volatility, stretch, and mapped evidence 4
Hang Seng Index Tracker
Hang Seng Index Tracker remains in a downtrend with low volatility. It is very oversold relative to trend. Price is 100.0% below the 50-day average and 100.0% below the 200-day average. The strongest mapped News & Events force is mainland growth slowdown weighs on hong kong exposure.
Risk: Downtrend, possible rebound riskHong Kong Broad Market
Hong Kong Broad Market is moving sideways with normal volatility. It is near trend relative to trend. Price is 0.7% below the 50-day average and 0.2% above the 200-day average. The strongest mapped News & Events force is mainland growth slowdown weighs on hong kong exposure.
Risk: Sideways, wait-and-seeHang Seng Technology Index
Hang Seng Technology Index remains in a downtrend with low volatility. It is very oversold relative to trend. Price is 100.0% below the 50-day average and 100.0% below the 200-day average. The strongest mapped News & Events force is mainland growth slowdown weighs on hong kong exposure.
Risk: Downtrend, possible rebound riskHong Kong High-Dividend Equity
Hong Kong High-Dividend Equity remains in a downtrend with low volatility. It is very oversold relative to trend. Price is 100.0% below the 50-day average and 100.0% below the 200-day average. The strongest mapped News & Events force is mainland growth slowdown weighs on hong kong exposure.
Risk: Downtrend, possible rebound risk9 China Equities Improving news meets weak technical confirmation Downtrend -0.3 Balanced
The medium-term technical regime is downtrend with mixed volatility and a technical score of -0.8. Verified News & Events evidence is positive overall, led by q2 growth and consumption slowed. Verified evidence is improving, but price confirmation remains weak or incomplete. Consolidation confidence is moderate.
Top 3 tailwinds
Global liquidity gained support
The event affects China Equities through monetary policy liquidity and the listed supplied exposures.
Event: The U.S. CPI fell 0.4% in June, while core CPI was unchanged; annual headline inflation slowed to 3.5% and core inflation to 2.6%.
AI demand supports tech
The event affects China Equities through business asset fundamentals and the listed supplied exposures.
Event: TSMC reported a 77% year-over-year profit increase, raised its revenue-growth outlook to more than 40%, and set 2026 capital spending at $60 billion to $64 billion.
High-tech output stayed strong
The event affects China Equities through business asset fundamentals and the listed supplied exposures.
Event: China reported 4.7% first-half GDP growth and 4.3% second-quarter growth. Industrial output rose 5.4%, high-tech manufacturing 13.3%, and exports 13.4%, but fixed-asset investment fell 5.7%, real-estate investment fell 18.0%, and retail sales rose only 1.3%.
Top 3 headwinds
Domestic growth slowed
The event affects China Equities through growth activity and the listed supplied exposures.
Event: China reported 4.7% first-half GDP growth and 4.3% second-quarter growth. Industrial output rose 5.4%, high-tech manufacturing 13.3%, and exports 13.4%, but fixed-asset investment fell 5.7%, real-estate investment fell 18.0%, and retail sales rose only 1.3%.
Energy input risk rose
The event affects China Equities through supply demand and the listed supplied exposures.
Event: Reports described intensified attacks, reduced vessel transit, and renewed concern about shipping and energy supply through the Strait of Hormuz. Oil remained near a monthly high despite a lower settlement on July 16.
4 of 6 symbols remain in medium-term downtrends.
4 of 6 symbols remain in medium-term downtrends.
Single-day detail Technical breadth, fresh-event pulse, and largest symbol moves 6
The single-day was mixed with 3 advancing, 2 declining, and 1 unchanged symbols. Daily conditions are diverging from the medium-term opportunity score of -0.8. Risk was normal and the risk-adjusted daily setup was balanced.
Inside the window from the July 15 close through the July 16 cutoff, fresh verified events produced a bullish directional balance and elevated event risk. The largest immediate driver was ai demand supports regional technology supply chains.
Price and breadth were mixed, while fresh-event direction was bullish with elevated event risk. The combined single-day setup is favorable with normal risk. The single-day picture diverges from the balanced medium-term regime.
Fresh-event pressure leaders
Largest normalized symbol moves
Full tailwind ledger Evidence, counterpoints, pressure, and sources 4
Global liquidity gained support
The event affects China Equities through monetary policy liquidity and the listed supplied exposures.
Event: The U.S. CPI fell 0.4% in June, while core CPI was unchanged; annual headline inflation slowed to 3.5% and core inflation to 2.6%.
How calculated
+18.9 = event impact +1.6 x factor weight 12% x 100. Exposure relevance = 50% symbol coverage + 30% directness + 20% transmission.
AI demand supports tech
The event affects China Equities through business asset fundamentals and the listed supplied exposures.
Event: TSMC reported a 77% year-over-year profit increase, raised its revenue-growth outlook to more than 40%, and set 2026 capital spending at $60 billion to $64 billion.
How calculated
+15.5 = event impact +1 x factor weight 15% x 100. Exposure relevance = 50% symbol coverage + 30% directness + 20% transmission.
High-tech output stayed strong
The event affects China Equities through business asset fundamentals and the listed supplied exposures.
Event: China reported 4.7% first-half GDP growth and 4.3% second-quarter growth. Industrial output rose 5.4%, high-tech manufacturing 13.3%, and exports 13.4%, but fixed-asset investment fell 5.7%, real-estate investment fell 18.0%, and retail sales rose only 1.3%.
How calculated
+10.2 = event impact +0.7 x factor weight 15% x 100. Exposure relevance = 50% symbol coverage + 30% directness + 20% transmission.
The single-day produced a mixed breadth-and-move score.
The single-day produced a mixed breadth-and-move score.
Full headwind ledger Evidence, counterpoints, pressure, and sources 3
Domestic growth slowed
The event affects China Equities through growth activity and the listed supplied exposures.
Event: China reported 4.7% first-half GDP growth and 4.3% second-quarter growth. Industrial output rose 5.4%, high-tech manufacturing 13.3%, and exports 13.4%, but fixed-asset investment fell 5.7%, real-estate investment fell 18.0%, and retail sales rose only 1.3%.
How calculated
-24.3 = event impact -1.3 x factor weight 18% x 100. Exposure relevance = 50% symbol coverage + 30% directness + 20% transmission.
Energy input risk rose
The event affects China Equities through supply demand and the listed supplied exposures.
Event: Reports described intensified attacks, reduced vessel transit, and renewed concern about shipping and energy supply through the Strait of Hormuz. Oil remained near a monthly high despite a lower settlement on July 16.
How calculated
-3.6 = event impact -1.8 x factor weight 2% x 100. Exposure relevance = 50% symbol coverage + 30% directness + 20% transmission.
4 of 6 symbols remain in medium-term downtrends.
4 of 6 symbols remain in medium-term downtrends.
Market-force scorecard Ranked News & Events transmission channels 5
Pressure methodology
Pressure is a signed evidence-strength measure, not a probability or forecast. Event impact = direction x event strength x exposure relevance x mechanism share. Weighted pressure = event impact x factor importance x 100. Expand "How calculated" beside any force for its exact components.
| Force | Direction | Factor | Pressure |
|---|---|---|---|
| Domestic growth slowed 8 The event affects China Equities through growth activity and the listed supplied exposures. | Headwind | Growth Activity |
-24.3
How calculated
Event strength
2.300
Symbol coverage
100%
Directness
98%
Transmission
92%
Exposure relevance
0.978
Mechanism share
60%
Event impact
-1.3
Factor weight
18%
-24.3 = event impact -1.3 x factor weight 18% x 100. Exposure relevance = 50% symbol coverage + 30% directness + 20% transmission. |
| Global liquidity gained support 1 The event affects China Equities through monetary policy liquidity and the listed supplied exposures. | Tailwind | Monetary Policy Liquidity |
+18.9
How calculated
Event strength
2.125
Symbol coverage
100%
Directness
50%
Transmission
45%
Exposure relevance
0.740
Mechanism share
100%
Event impact
+1.6
Factor weight
12%
+18.9 = event impact +1.6 x factor weight 12% x 100. Exposure relevance = 50% symbol coverage + 30% directness + 20% transmission. |
| AI demand supports tech 18 The event affects China Equities through business asset fundamentals and the listed supplied exposures. | Tailwind | Business Asset Fundamentals |
+15.5
How calculated
Event strength
2.227
Symbol coverage
50%
Directness
45%
Transmission
40%
Exposure relevance
0.465
Mechanism share
100%
Event impact
+1
Factor weight
15%
+15.5 = event impact +1 x factor weight 15% x 100. Exposure relevance = 50% symbol coverage + 30% directness + 20% transmission. |
| High-tech output stayed strong 8 The event affects China Equities through business asset fundamentals and the listed supplied exposures. | Tailwind | Business Asset Fundamentals |
+10.2
How calculated
Event strength
2.300
Symbol coverage
65%
Directness
85%
Transmission
78%
Exposure relevance
0.736
Mechanism share
40%
Event impact
+0.7
Factor weight
15%
+10.2 = event impact +0.7 x factor weight 15% x 100. Exposure relevance = 50% symbol coverage + 30% directness + 20% transmission. |
| Energy input risk rose 1314 The event affects China Equities through supply demand and the listed supplied exposures. | Headwind | Supply Demand |
-3.6
How calculated
Event strength
2.325
Symbol coverage
85%
Directness
75%
Transmission
65%
Exposure relevance
0.780
Mechanism share
100%
Event impact
-1.8
Factor weight
2%
-3.6 = event impact -1.8 x factor weight 2% x 100. Exposure relevance = 50% symbol coverage + 30% directness + 20% transmission. |
Symbol intelligence Trend, volatility, stretch, and mapped evidence 6
China A-Shares
China A-Shares is moving sideways with elevated volatility. It is near trend relative to trend. Price is 3.2% below the 50-day average and 2.6% above the 200-day average. The strongest mapped News & Events force is q2 growth and consumption slowed.
Risk: Choppy range, short-term trading onlyChina Broad Market
China Broad Market remains in a downtrend with normal volatility. It is near trend relative to trend. Price is 0.5% below the 50-day average and 7.9% below the 200-day average. The strongest mapped News & Events force is q2 growth and consumption slowed.
Risk: Persistent downtrendChina Large-Cap
China Large-Cap remains in a downtrend with normal volatility. It is near trend relative to trend. Price is 0.1% below the 50-day average and 7.2% below the 200-day average. The strongest mapped News & Events force is q2 growth and consumption slowed.
Risk: Persistent downtrendChina Internet Sector
China Internet Sector remains in a downtrend with elevated volatility. It is near trend relative to trend. Price is 2.6% above the 50-day average and 14.3% below the 200-day average. The strongest mapped News & Events force is q2 growth and consumption slowed.
Risk: High downside riskChina Consumer Sector
China Consumer Sector remains in a downtrend with normal volatility. It is near trend relative to trend. Price is 0.8% above the 50-day average and 11.9% below the 200-day average. The strongest mapped News & Events force is q2 growth and consumption slowed.
Risk: Persistent downtrendChina Technology Sector
China Technology Sector is moving sideways with elevated volatility. It is near trend relative to trend. Price is 1.2% below the 50-day average and 0.6% above the 200-day average. The strongest mapped News & Events force is q2 growth and consumption slowed.
Risk: Choppy range, short-term trading only10 Metals Improving news meets weak technical confirmation Downtrend -0.5 Cautious
The medium-term technical regime is downtrend with elevated volatility and a technical score of -1.4. Verified News & Events evidence is positive overall, led by cooling cpi supports precious metals through rate relief. Verified evidence is improving, but price confirmation remains weak or incomplete. Consolidation confidence is moderate.
Top 3 tailwinds
CPI supports precious metals
The event affects Metals through monetary policy liquidity and the listed supplied exposures.
Event: The U.S. CPI fell 0.4% in June, while core CPI was unchanged; annual headline inflation slowed to 3.5% and core inflation to 2.6%.
AI capex supports copper
The event affects Metals through supply demand and the listed supplied exposures.
Event: TSMC reported a 77% year-over-year profit increase, raised its revenue-growth outlook to more than 40%, and set 2026 capital spending at $60 billion to $64 billion.
Safe-haven demand increased
The event affects Metals through geopolitics trade and the listed supplied exposures.
Event: Reports described intensified attacks, reduced vessel transit, and renewed concern about shipping and energy supply through the Strait of Hormuz. Oil remained near a monthly high despite a lower settlement on July 16.
Top 3 headwinds
Fed restraint weighs
The event affects Metals through monetary policy liquidity and the listed supplied exposures.
Event: Minutes of the June meeting described elevated inflation, higher energy and input costs, and tariff effects, while staff expected inflation to slow later but remain sticky in core components.
China property weakness
The event affects Metals through growth activity and the listed supplied exposures.
Event: China reported 4.7% first-half GDP growth and 4.3% second-quarter growth. Industrial output rose 5.4%, high-tech manufacturing 13.3%, and exports 13.4%, but fixed-asset investment fell 5.7%, real-estate investment fell 18.0%, and retail sales rose only 1.3%.
Core PPI preserves yield risk
The event affects Metals through inflation rates and the listed supplied exposures.
Event: Final-demand PPI fell 0.3% in June and goods prices fell 1.4%, but the measure excluding food, energy, and trade services rose 0.1% and remained 5.1% above a year earlier.
Single-day detail Technical breadth, fresh-event pulse, and largest symbol moves 7
The single-day was bearish with 0 advancing, 6 declining, and 1 unchanged symbols. Daily conditions are aligned with the medium-term regime. Risk was normal and the risk-adjusted daily setup was cautious.
Inside the window from the July 15 close through the July 16 cutoff, fresh verified events produced a strong bullish directional balance and high event risk. The largest immediate driver was ai capex supports copper-intensive infrastructure demand.
Price and breadth were bearish, while fresh-event direction was strong bullish with high event risk. The combined single-day setup is balanced with elevated risk. The single-day picture diverges from the cautious medium-term regime.
Fresh-event pressure leaders
Largest normalized symbol moves
Full tailwind ledger Evidence, counterpoints, pressure, and sources 6
CPI supports precious metals
The event affects Metals through monetary policy liquidity and the listed supplied exposures.
Event: The U.S. CPI fell 0.4% in June, while core CPI was unchanged; annual headline inflation slowed to 3.5% and core inflation to 2.6%.
How calculated
+26.7 = event impact +1.6 x factor weight 17% x 100. Exposure relevance = 50% symbol coverage + 30% directness + 20% transmission.
AI capex supports copper
The event affects Metals through supply demand and the listed supplied exposures.
Event: TSMC reported a 77% year-over-year profit increase, raised its revenue-growth outlook to more than 40%, and set 2026 capital spending at $60 billion to $64 billion.
How calculated
+15 = event impact +1.1 x factor weight 14% x 100. Exposure relevance = 50% symbol coverage + 30% directness + 20% transmission.
Safe-haven demand increased
The event affects Metals through geopolitics trade and the listed supplied exposures.
Event: Reports described intensified attacks, reduced vessel transit, and renewed concern about shipping and energy supply through the Strait of Hormuz. Oil remained near a monthly high despite a lower settlement on July 16.
How calculated
+10 = event impact +1 x factor weight 10% x 100. Exposure relevance = 50% symbol coverage + 30% directness + 20% transmission.
PPI eases rate pressure
The event affects Metals through inflation rates and the listed supplied exposures.
Event: Final-demand PPI fell 0.3% in June and goods prices fell 1.4%, but the measure excluding food, energy, and trade services rose 0.1% and remained 5.1% above a year earlier.
How calculated
+5.8 = event impact +0.5 x factor weight 12% x 100. Exposure relevance = 50% symbol coverage + 30% directness + 20% transmission.
High-tech output supports demand
The event affects Metals through business asset fundamentals and the listed supplied exposures.
Event: China reported 4.7% first-half GDP growth and 4.3% second-quarter growth. Industrial output rose 5.4%, high-tech manufacturing 13.3%, and exports 13.4%, but fixed-asset investment fell 5.7%, real-estate investment fell 18.0%, and retail sales rose only 1.3%.
How calculated
+1.3 = event impact +0.4 x factor weight 3% x 100. Exposure relevance = 50% symbol coverage + 30% directness + 20% transmission.
1 of 7 symbols remain in medium-term uptrends.
1 of 7 symbols remain in medium-term uptrends.
Full headwind ledger Evidence, counterpoints, pressure, and sources 5
Fed restraint weighs
The event affects Metals through monetary policy liquidity and the listed supplied exposures.
Event: Minutes of the June meeting described elevated inflation, higher energy and input costs, and tariff effects, while staff expected inflation to slow later but remain sticky in core components.
How calculated
-10.9 = event impact -0.6 x factor weight 17% x 100. Exposure relevance = 50% symbol coverage + 30% directness + 20% transmission.
China property weakness
The event affects Metals through growth activity and the listed supplied exposures.
Event: China reported 4.7% first-half GDP growth and 4.3% second-quarter growth. Industrial output rose 5.4%, high-tech manufacturing 13.3%, and exports 13.4%, but fixed-asset investment fell 5.7%, real-estate investment fell 18.0%, and retail sales rose only 1.3%.
How calculated
-7.9 = event impact -1 x factor weight 8% x 100. Exposure relevance = 50% symbol coverage + 30% directness + 20% transmission.
Core PPI preserves yield risk
The event affects Metals through inflation rates and the listed supplied exposures.
Event: Final-demand PPI fell 0.3% in June and goods prices fell 1.4%, but the measure excluding food, energy, and trade services rose 0.1% and remained 5.1% above a year earlier.
How calculated
-4.5 = event impact -0.4 x factor weight 12% x 100. Exposure relevance = 50% symbol coverage + 30% directness + 20% transmission.
Trade risk weighs on metals
The event affects Metals through growth activity and the listed supplied exposures.
Event: Reports described intensified attacks, reduced vessel transit, and renewed concern about shipping and energy supply through the Strait of Hormuz. Oil remained near a monthly high despite a lower settlement on July 16.
How calculated
-3.9 = event impact -0.5 x factor weight 8% x 100. Exposure relevance = 50% symbol coverage + 30% directness + 20% transmission.
4 of 7 symbols remain in medium-term downtrends.
4 of 7 symbols remain in medium-term downtrends.
Market-force scorecard Ranked News & Events transmission channels 9
Pressure methodology
Pressure is a signed evidence-strength measure, not a probability or forecast. Event impact = direction x event strength x exposure relevance x mechanism share. Weighted pressure = event impact x factor importance x 100. Expand "How calculated" beside any force for its exact components.
| Force | Direction | Factor | Pressure |
|---|---|---|---|
| CPI supports precious metals 1 The event affects Metals through monetary policy liquidity and the listed supplied exposures. | Tailwind | Monetary Policy Liquidity |
+26.7
How calculated
Event strength
2.125
Symbol coverage
65%
Directness
85%
Transmission
80%
Exposure relevance
0.740
Mechanism share
100%
Event impact
+1.6
Factor weight
17%
+26.7 = event impact +1.6 x factor weight 17% x 100. Exposure relevance = 50% symbol coverage + 30% directness + 20% transmission. |
| AI capex supports copper 18 The event affects Metals through supply demand and the listed supplied exposures. | Tailwind | Supply Demand |
+15
How calculated
Event strength
2.227
Symbol coverage
35%
Directness
65%
Transmission
55%
Exposure relevance
0.480
Mechanism share
100%
Event impact
+1.1
Factor weight
14%
+15 = event impact +1.1 x factor weight 14% x 100. Exposure relevance = 50% symbol coverage + 30% directness + 20% transmission. |
| Fed restraint weighs 7 The event affects Metals through monetary policy liquidity and the listed supplied exposures. | Headwind | Monetary Policy Liquidity |
-10.9
How calculated
Event strength
0.835
Symbol coverage
65%
Directness
90%
Transmission
85%
Exposure relevance
0.765
Mechanism share
100%
Event impact
-0.6
Factor weight
17%
-10.9 = event impact -0.6 x factor weight 17% x 100. Exposure relevance = 50% symbol coverage + 30% directness + 20% transmission. |
| Safe-haven demand increased 1314 The event affects Metals through geopolitics trade and the listed supplied exposures. | Tailwind | Geopolitics Trade |
+10
How calculated
Event strength
2.325
Symbol coverage
55%
Directness
90%
Transmission
85%
Exposure relevance
0.715
Mechanism share
60%
Event impact
+1
Factor weight
10%
+10 = event impact +1 x factor weight 10% x 100. Exposure relevance = 50% symbol coverage + 30% directness + 20% transmission. |
| China property weakness 8 The event affects Metals through growth activity and the listed supplied exposures. | Headwind | Growth Activity |
-7.9
How calculated
Event strength
2.300
Symbol coverage
60%
Directness
85%
Transmission
80%
Exposure relevance
0.715
Mechanism share
60%
Event impact
-1
Factor weight
8%
-7.9 = event impact -1 x factor weight 8% x 100. Exposure relevance = 50% symbol coverage + 30% directness + 20% transmission. |
| PPI eases rate pressure 2 The event affects Metals through inflation rates and the listed supplied exposures. | Tailwind | Inflation Rates |
+5.8
How calculated
Event strength
1.333
Symbol coverage
65%
Directness
70%
Transmission
60%
Exposure relevance
0.655
Mechanism share
55%
Event impact
+0.5
Factor weight
12%
+5.8 = event impact +0.5 x factor weight 12% x 100. Exposure relevance = 50% symbol coverage + 30% directness + 20% transmission. |
| Core PPI preserves yield risk 2 The event affects Metals through inflation rates and the listed supplied exposures. | Headwind | Inflation Rates |
-4.5
How calculated
Event strength
1.333
Symbol coverage
65%
Directness
65%
Transmission
55%
Exposure relevance
0.630
Mechanism share
45%
Event impact
-0.4
Factor weight
12%
-4.5 = event impact -0.4 x factor weight 12% x 100. Exposure relevance = 50% symbol coverage + 30% directness + 20% transmission. |
| Trade risk weighs on metals 1314 The event affects Metals through growth activity and the listed supplied exposures. | Headwind | Growth Activity |
-3.9
How calculated
Event strength
2.325
Symbol coverage
45%
Directness
65%
Transmission
55%
Exposure relevance
0.530
Mechanism share
40%
Event impact
-0.5
Factor weight
8%
-3.9 = event impact -0.5 x factor weight 8% x 100. Exposure relevance = 50% symbol coverage + 30% directness + 20% transmission. |
| High-tech output supports demand 8 The event affects Metals through business asset fundamentals and the listed supplied exposures. | Tailwind | Business Asset Fundamentals |
+1.3
How calculated
Event strength
2.300
Symbol coverage
35%
Directness
65%
Transmission
55%
Exposure relevance
0.480
Mechanism share
40%
Event impact
+0.4
Factor weight
3%
+1.3 = event impact +0.4 x factor weight 3% x 100. Exposure relevance = 50% symbol coverage + 30% directness + 20% transmission. |
Symbol intelligence Trend, volatility, stretch, and mapped evidence 7
Gold
Gold remains in a downtrend with elevated volatility. It is oversold relative to trend. Price is 8.1% below the 50-day average and 11.3% below the 200-day average. The strongest mapped News & Events force is cooling cpi supports precious metals through rate relief.
Risk: High downside riskCopper
Copper remains in an uptrend with normal volatility. It is near trend relative to trend. Price is 0.9% below the 50-day average and 8.1% above the 200-day average. The strongest mapped News & Events force is ai capex supports copper-intensive infrastructure demand.
Risk: Favorable uptrend setupSilver
Silver remains in a downtrend with high volatility. It is very oversold relative to trend. Price is 19.3% below the 50-day average and 20.2% below the 200-day average. The strongest mapped News & Events force is cooling cpi supports precious metals through rate relief.
Risk: High downside riskBase Metals
Base Metals is moving sideways with normal volatility. It is near trend relative to trend. Price is 2.5% below the 50-day average and 5.1% above the 200-day average. The strongest mapped News & Events force is ai capex supports copper-intensive infrastructure demand.
Risk: Sideways, wait-and-seeGold Miners
Gold Miners remains in a downtrend with high volatility. It is very oversold relative to trend. Price is 13.6% below the 50-day average and 18.3% below the 200-day average. The strongest mapped News & Events force is cooling cpi supports precious metals through rate relief.
Risk: High downside riskGlobal Metals and Mining
Global Metals and Mining is moving sideways with elevated volatility. It is oversold relative to trend. Price is 8.3% below the 50-day average and 2.6% above the 200-day average. The strongest mapped News & Events force is ai capex supports copper-intensive infrastructure demand.
Risk: Choppy range, short-term trading onlyPlatinum
Platinum remains in a downtrend with elevated volatility. It is very oversold relative to trend. Price is 10.1% below the 50-day average and 15.4% below the 200-day average. The strongest mapped News & Events force is cooling cpi supports precious metals through rate relief.
Risk: High downside risk11 Crypto Technical weakness dominates balanced news evidence Downtrend -0.8 Cautious
The medium-term technical regime is downtrend with elevated volatility and a technical score of -1.4. Verified News & Events evidence is neutral overall, led by cooling cpi supports liquidity-sensitive crypto assets. Technical conditions are cautious while News & Events evidence remains balanced. Consolidation confidence is moderate-high.
Top 3 tailwinds
CPI supports liquidity
The event affects Crypto through monetary policy liquidity and the listed supplied exposures.
Event: The U.S. CPI fell 0.4% in June, while core CPI was unchanged; annual headline inflation slowed to 3.5% and core inflation to 2.6%.
SEC clarity supports access
The event affects Crypto through policy regulation and the listed supplied exposures.
Event: The SEC clarified treatment of non-security crypto assets and activities including staking, mining, airdrops, and wrapping, reducing some legal ambiguity for market participants.
PPI supports rate relief
The event affects Crypto through monetary policy liquidity and the listed supplied exposures.
Event: Final-demand PPI fell 0.3% in June and goods prices fell 1.4%, but the measure excluding food, energy, and trade services rose 0.1% and remained 5.1% above a year earlier.
Top 3 headwinds
Compliance risk increased
The event affects Crypto through policy regulation and the listed supplied exposures.
Event: FATF reported that regulatory gaps allowed organized-crime groups to move billions through crypto, increasing pressure for enforcement and compliance changes.
Fed restraint weighs
The event affects Crypto through monetary policy liquidity and the listed supplied exposures.
Event: Minutes of the June meeting described elevated inflation, higher energy and input costs, and tariff effects, while staff expected inflation to slow later but remain sticky in core components.
ETF outflows persist
The event affects Crypto through flows positioning and the listed supplied exposures.
Event: Citi estimated that bitcoin ETF flows were about $3.3 billion negative year to date by early July and reduced bitcoin and ether forecasts.
Single-day detail Technical breadth, fresh-event pulse, and largest symbol moves 6
The single-day was bearish with 0 advancing, 6 declining, and 0 unchanged symbols. Daily conditions are aligned with the medium-term regime. Risk was normal and the risk-adjusted daily setup was cautious.
Inside the window from the July 15 close through the July 16 cutoff, fresh verified events produced a strong bearish directional balance and elevated event risk. The largest immediate driver was fatf findings raise compliance and enforcement risk.
Price and breadth were bearish, while fresh-event direction was strong bearish with elevated event risk. The combined single-day setup is cautious with elevated risk.
Fresh-event pressure leaders
Largest normalized symbol moves
Full tailwind ledger Evidence, counterpoints, pressure, and sources 4
CPI supports liquidity
The event affects Crypto through monetary policy liquidity and the listed supplied exposures.
Event: The U.S. CPI fell 0.4% in June, while core CPI was unchanged; annual headline inflation slowed to 3.5% and core inflation to 2.6%.
How calculated
+36 = event impact +2 x factor weight 18% x 100. Exposure relevance = 50% symbol coverage + 30% directness + 20% transmission.
SEC clarity supports access
The event affects Crypto through policy regulation and the listed supplied exposures.
Event: The SEC clarified treatment of non-security crypto assets and activities including staking, mining, airdrops, and wrapping, reducing some legal ambiguity for market participants.
How calculated
+23.4 = event impact +1.7 x factor weight 14% x 100. Exposure relevance = 50% symbol coverage + 30% directness + 20% transmission.
PPI supports rate relief
The event affects Crypto through monetary policy liquidity and the listed supplied exposures.
Event: Final-demand PPI fell 0.3% in June and goods prices fell 1.4%, but the measure excluding food, energy, and trade services rose 0.1% and remained 5.1% above a year earlier.
How calculated
+11 = event impact +0.6 x factor weight 18% x 100. Exposure relevance = 50% symbol coverage + 30% directness + 20% transmission.
Average price is 1.7% above the 50-day trend.
Average price is 1.7% above the 50-day trend.
Full headwind ledger Evidence, counterpoints, pressure, and sources 6
Compliance risk increased
The event affects Crypto through policy regulation and the listed supplied exposures.
Event: FATF reported that regulatory gaps allowed organized-crime groups to move billions through crypto, increasing pressure for enforcement and compliance changes.
How calculated
-15.2 = event impact -1.1 x factor weight 14% x 100. Exposure relevance = 50% symbol coverage + 30% directness + 20% transmission.
Fed restraint weighs
The event affects Crypto through monetary policy liquidity and the listed supplied exposures.
Event: Minutes of the June meeting described elevated inflation, higher energy and input costs, and tariff effects, while staff expected inflation to slow later but remain sticky in core components.
How calculated
-14.1 = event impact -0.8 x factor weight 18% x 100. Exposure relevance = 50% symbol coverage + 30% directness + 20% transmission.
ETF outflows persist
The event affects Crypto through flows positioning and the listed supplied exposures.
Event: Citi estimated that bitcoin ETF flows were about $3.3 billion negative year to date by early July and reduced bitcoin and ether forecasts.
How calculated
-9.2 = event impact -0.6 x factor weight 16% x 100. Exposure relevance = 50% symbol coverage + 30% directness + 20% transmission.
Risk aversion increased
The event affects Crypto through geopolitics trade and the listed supplied exposures.
Event: Reports described intensified attacks, reduced vessel transit, and renewed concern about shipping and energy supply through the Strait of Hormuz. Oil remained near a monthly high despite a lower settlement on July 16.
How calculated
-7.6 = event impact -1.9 x factor weight 4% x 100. Exposure relevance = 50% symbol coverage + 30% directness + 20% transmission.
Core PPI limits easing
The event affects Crypto through inflation rates and the listed supplied exposures.
Event: Final-demand PPI fell 0.3% in June and goods prices fell 1.4%, but the measure excluding food, energy, and trade services rose 0.1% and remained 5.1% above a year earlier.
How calculated
-2.9 = event impact -0.5 x factor weight 6% x 100. Exposure relevance = 50% symbol coverage + 30% directness + 20% transmission.
4 of 6 symbols remain in medium-term downtrends.
4 of 6 symbols remain in medium-term downtrends.
Market-force scorecard Ranked News & Events transmission channels 8
Pressure methodology
Pressure is a signed evidence-strength measure, not a probability or forecast. Event impact = direction x event strength x exposure relevance x mechanism share. Weighted pressure = event impact x factor importance x 100. Expand "How calculated" beside any force for its exact components.
| Force | Direction | Factor | Pressure |
|---|---|---|---|
| CPI supports liquidity 1 The event affects Crypto through monetary policy liquidity and the listed supplied exposures. | Tailwind | Monetary Policy Liquidity |
+36
How calculated
Event strength
2.125
Symbol coverage
100%
Directness
90%
Transmission
85%
Exposure relevance
0.940
Mechanism share
100%
Event impact
+2
Factor weight
18%
+36 = event impact +2 x factor weight 18% x 100. Exposure relevance = 50% symbol coverage + 30% directness + 20% transmission. |
| SEC clarity supports access 19 The event affects Crypto through policy regulation and the listed supplied exposures. | Tailwind | Policy Regulation |
+23.4
How calculated
Event strength
1.778
Symbol coverage
100%
Directness
90%
Transmission
85%
Exposure relevance
0.940
Mechanism share
100%
Event impact
+1.7
Factor weight
14%
+23.4 = event impact +1.7 x factor weight 14% x 100. Exposure relevance = 50% symbol coverage + 30% directness + 20% transmission. |
| Compliance risk increased 21 The event affects Crypto through policy regulation and the listed supplied exposures. | Headwind | Policy Regulation |
-15.2
How calculated
Event strength
1.196
Symbol coverage
100%
Directness
85%
Transmission
75%
Exposure relevance
0.905
Mechanism share
100%
Event impact
-1.1
Factor weight
14%
-15.2 = event impact -1.1 x factor weight 14% x 100. Exposure relevance = 50% symbol coverage + 30% directness + 20% transmission. |
| Fed restraint weighs 7 The event affects Crypto through monetary policy liquidity and the listed supplied exposures. | Headwind | Monetary Policy Liquidity |
-14.1
How calculated
Event strength
0.835
Symbol coverage
100%
Directness
90%
Transmission
85%
Exposure relevance
0.940
Mechanism share
100%
Event impact
-0.8
Factor weight
18%
-14.1 = event impact -0.8 x factor weight 18% x 100. Exposure relevance = 50% symbol coverage + 30% directness + 20% transmission. |
| PPI supports rate relief 2 The event affects Crypto through monetary policy liquidity and the listed supplied exposures. | Tailwind | Monetary Policy Liquidity |
+11
How calculated
Event strength
1.333
Symbol coverage
100%
Directness
70%
Transmission
60%
Exposure relevance
0.830
Mechanism share
55%
Event impact
+0.6
Factor weight
18%
+11 = event impact +0.6 x factor weight 18% x 100. Exposure relevance = 50% symbol coverage + 30% directness + 20% transmission. |
| ETF outflows persist 20 The event affects Crypto through flows positioning and the listed supplied exposures. | Headwind | Flows Positioning |
-9.2
How calculated
Event strength
0.703
Symbol coverage
70%
Directness
95%
Transmission
90%
Exposure relevance
0.815
Mechanism share
100%
Event impact
-0.6
Factor weight
16%
-9.2 = event impact -0.6 x factor weight 16% x 100. Exposure relevance = 50% symbol coverage + 30% directness + 20% transmission. |
| Risk aversion increased 1314 The event affects Crypto through geopolitics trade and the listed supplied exposures. | Headwind | Geopolitics Trade |
-7.6
How calculated
Event strength
2.325
Symbol coverage
100%
Directness
65%
Transmission
60%
Exposure relevance
0.815
Mechanism share
100%
Event impact
-1.9
Factor weight
4%
-7.6 = event impact -1.9 x factor weight 4% x 100. Exposure relevance = 50% symbol coverage + 30% directness + 20% transmission. |
| Core PPI limits easing 2 The event affects Crypto through inflation rates and the listed supplied exposures. | Headwind | Inflation Rates |
-2.9
How calculated
Event strength
1.333
Symbol coverage
100%
Directness
65%
Transmission
55%
Exposure relevance
0.805
Mechanism share
45%
Event impact
-0.5
Factor weight
6%
-2.9 = event impact -0.5 x factor weight 6% x 100. Exposure relevance = 50% symbol coverage + 30% directness + 20% transmission. |
Symbol intelligence Trend, volatility, stretch, and mapped evidence 6
Bitcoin
Bitcoin remains in a downtrend with elevated volatility. It is near trend relative to trend. Price is 0.3% above the 50-day average and 12.7% below the 200-day average. The strongest mapped News & Events force is cooling cpi supports liquidity-sensitive crypto assets.
Risk: High downside riskEthereum
Ethereum is moving sideways with high volatility. It is overbought relative to trend. Price is 7.2% above the 50-day average and 15.0% below the 200-day average. The strongest mapped News & Events force is cooling cpi supports liquidity-sensitive crypto assets.
Risk: Choppy range, short-term trading onlySolana
Solana is moving sideways with high volatility. It is near trend relative to trend. Price is 2.6% above the 50-day average and 16.6% below the 200-day average. The strongest mapped News & Events force is cooling cpi supports liquidity-sensitive crypto assets.
Risk: Choppy range, short-term trading onlyXRP
XRP remains in a downtrend with elevated volatility. It is near trend relative to trend. Price is 3.9% below the 50-day average and 23.6% below the 200-day average. The strongest mapped News & Events force is cooling cpi supports liquidity-sensitive crypto assets.
Risk: High downside riskBNB
BNB remains in a downtrend with elevated volatility. It is near trend relative to trend. Price is 3.0% below the 50-day average and 14.0% below the 200-day average. The strongest mapped News & Events force is cooling cpi supports liquidity-sensitive crypto assets.
Risk: High downside riskCardano
Cardano remains in a downtrend with high volatility. It is oversold relative to trend. Price is 5.8% below the 50-day average and 36.9% below the 200-day average. The strongest mapped News & Events force is cooling cpi supports liquidity-sensitive crypto assets.
Risk: High downside riskEvidence library Primary and authoritative sources referenced in the analysis 22
-
1
Consumer Price Index - June 2026 U.S. Bureau of Labor Statistics
-
2
Producer Price Index - June 2026 U.S. Bureau of Labor Statistics
-
3
Advance Monthly Sales for Retail and Food Services, June 2026 U.S. Census Bureau
-
4
Unemployment Insurance Weekly Claims U.S. Department of Labor
-
5
July 2026 Manufacturing Business Outlook Survey Federal Reserve Bank of Philadelphia
-
6
The Beige Book - July 2026 Summary Board of Governors of the Federal Reserve System
-
7
Minutes of the Federal Open Market Committee, June 16-17, 2026 Board of Governors of the Federal Reserve System
-
8
National Economy Maintained Stable Growth in the First Half of 2026 National Bureau of Statistics of China
-
9
Euro area annual inflation down to 2.8% Eurostat
-
10
Euro indicators: industrial production Eurostat
-
11
ECB to hold rates now; energy-price resurgence points to September hike Reuters
-
12
Bank of Japan monetary policy information Bank of Japan
-
13
Iran warns Strait of Hormuz is a red line as conflict intensifies Reuters
-
14
Oil settles lower but remains near monthly high amid Iran conflict Reuters
-
15
Primary Mortgage Market Survey Freddie Mac
-
16
Pending Home Sales Decreased 5.4% in June National Association of Realtors
-
17
Wall Street banks see deal fees and trading lift profit Reuters
-
18
TSMC profit jumps as AI demand drives stronger outlook Associated Press
-
19
SEC Clarifies Application of Federal Securities Laws to Crypto Assets U.S. Securities and Exchange Commission
-
20
Citi cuts bitcoin and ether forecasts as ETF flows turn negative Reuters
-
21
FATF warns regulatory gaps allow organized crime to move billions through crypto Reuters
-
22
Monetary Policy Meeting Schedule Bank of Japan
Methodology and disclosures Scoring, timestamps, and analytical limitations i
Medium-term opportunity: Technical/Pricing receives a 60% weight and News & Events receives a 40% weight when both branches are usable. Technical, News, and Combined scores range from -3 to +3 and are not expected returns.
Single-day lens: Daily direction combines 60% technical price/breadth direction and 40% fresh-event direction. Daily opportunity combines 60% risk-adjusted technical opportunity and 40% fresh-event direction. Daily risk combines 60% technical move/volatility risk and 40% event disruption risk. Unavailable branches are never treated as zero.
Pressure: A signed measure of verified evidence strength. Event impact combines direction, event strength, exposure relevance, and any mechanism allocation. Weighted pressure multiplies event impact by the asset's fixed factor importance and by 100. It is not a probability or expected return.
Divergence: The absolute difference between the Technical and News opportunity scores. Daily/medium-term divergence separately identifies whether the single-day market action confirms or challenges the broader regime.
Research cutoff: Jul 16, 2026, 4:55 PM EDT. Generated: Jul 16, 2026, 5:19 PM EDT.